Our new paper, “Detecting the causal influence of thermal environments among climate regions in the United States“, is published in Journal of Environmental Management (IF: 8.910). This paper is from the collaboration with the Urban Environment Research Group at Arizona State University (ASU). The first author, Xueli Yang, is a Ph.D. candidate at ASU. Congratulations to Xueli!
The Share Link to download a copy of our paper is https://authors.elsevier.com/c/1fepj14Z6tlDl~ (valid until Oct 15, 2022).
Authors: Xueli Yang, Zhi-Hua Wang, Chenghao Wang, and Ying-Cheng Lai
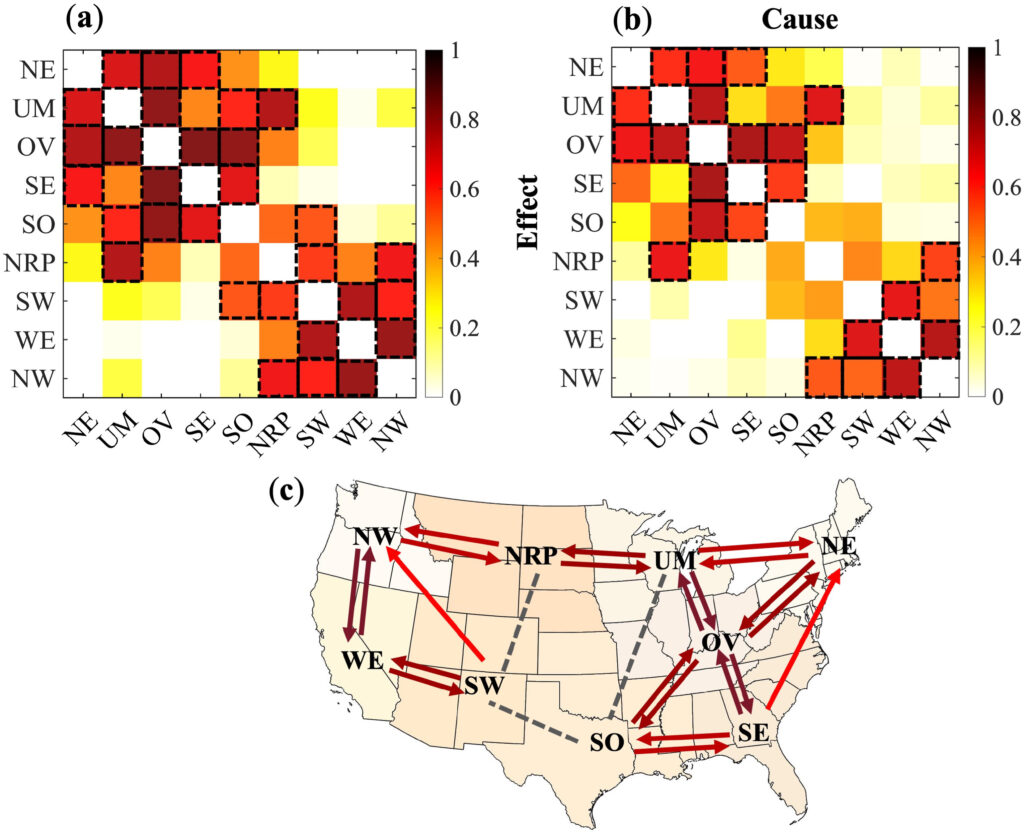
Abstract: The quantification of cross-regional interactions for the atmospheric transport processes is of crucial importance to improve the predictive capacity of climatic and environmental system modeling. The dynamic interactions in these complex systems are often nonlinear and non-separable, making conventional approaches of causal inference, such as statistical correlation or Granger causality, infeasible or ineffective. In this study, we applied an advanced approach, based on the convergent cross mapping algorithm, to detect and quantify the causal influence among different climate regions in the contiguous U.S. in response to temperature perturbations using the long-term (1901–2018) climatology of near surface air temperature record. Our results show that the directed causal network constructed by convergent cross mapping algorithm, enables us to distinguish the causal links from spurious ones rendered by statistical correlation. We also find that the Ohio Valley region, as an atmospheric convergent zone, acts as the regional gateway and mediator to the long-term thermal environments in the U.S. In addition, the temporal evolution of dynamic causality of temperature exhibits superposition of periodicities at various time scales, highlighting the impact of prominent low frequency climate variabilities such as El Niño–Southern Oscillation. The proposed method in this work will help to promote novel system-based and data-driven framework in studying the integrated environmental system dynamics.
DOI: https://doi.org/10.1016/j.jenvman.2022.116001