Our new paper, “Wastewater-influenced estuaries are characterized by disproportionately high nitrous oxide emissions but overestimated IPCC emission factor“, is published in Communications Earth & Environment (IF: 7.9).
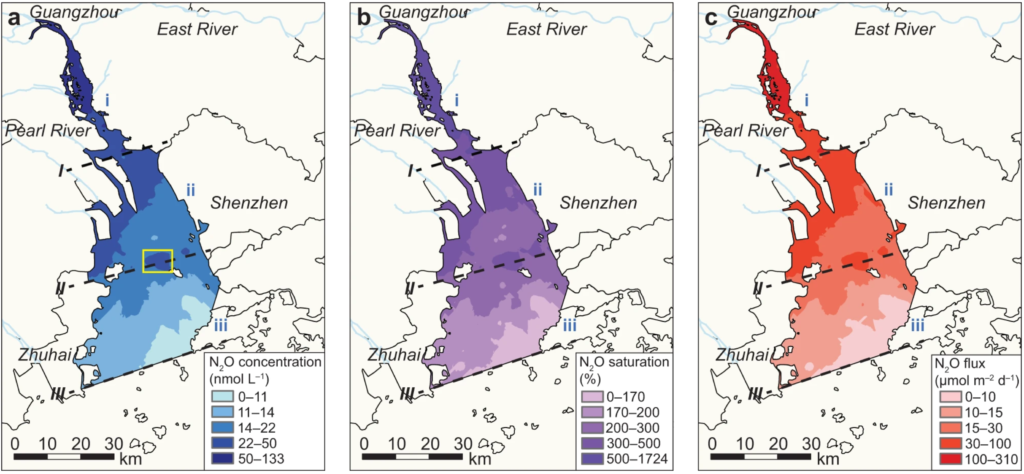
Abstract: Estuaries play an important role in the global nitrous oxide budget. However, considerable uncertainties exist in estimating their nitrous oxide emissions, largely due to anthropogenic impacts, particularly wastewater discharge. Here we investigate nitrous oxide emission dynamics in the Pearl River Estuary through advanced high-resolution, real-time measurements. Results suggest that Pearl River Estuary is a strong nitrous oxide emission source (1.05 Gg yr−1; range: 0.92–1.23 Gg yr−1) with pronounced spatial heterogeneity. Wastewater discharge substantially impacts emissions by introducing abundant nutrients, altering carbon-to-nitrogen stoichiometry, and stimulating biochemical processes. A meta-analysis further reveals the widespread enhancement of nitrous oxide emission induced by wastewater nitrogen input in global estuaries, with nitrous oxide emission factors considerably lower than that suggested by the IPCC owing to progressive biological saturation. Consequently, refining emission factor estimates through comprehensive bottom-up studies is imperative to improve the understanding of estuarine contributions to the global nitrous oxide budget.
Fig. 2.Spatial distribution of N2O concentrations, saturations, and air–water fluxes in the Pearl River Estuary.a Dissolved N2O concentrations. b N2O saturations. c N2O fluxes. Spatial distributions were interpolated from high-resolution, real-time data using Kriging interpolation. The yellow box in (a) indicates the N2O concentration hotspot to the northwest of Inner Lingding Island.
Our new paper, “Evaluation of 30 urban land surface models in the Urban-PLUMBER project: Phase 1 results“, is published in Quarterly Journal of the Royal Meteorological Society (IF: 8.9).
Authors: Lipson, M. J., Grimmond, S., Best, M., Abramowitz, G., Coutts, A., Tapper, N., Baik, J.-J., Beyers, M., Blunn, L., Boussetta, S., Bou-Zeid, E., De Kauwe, M. G., de Munck, C., Demuzere, M., Fatichi, S., Fortuniak, K., Han, B.-S., Hendry, M., Kikegawa, Y., Kondo, H., Lee, D.-I., Lee, S.-H., Lemonsu, A., Machado, T., Manoli, G., Martilli, A., Masson, V., McNorton, J., Meili, N., Meyer, D., Nice, K. A., Oleson, K. W., Park, S.-B., Roth, M., Schoetter, R., Simón-Moral, A., Steeneveld, G.-J., Sun, T., Takane, Y., Thatcher, M., Tsiringakis, A., Varentsov, M., Wang, C., Wang, Z.-H., & Pitman, A.
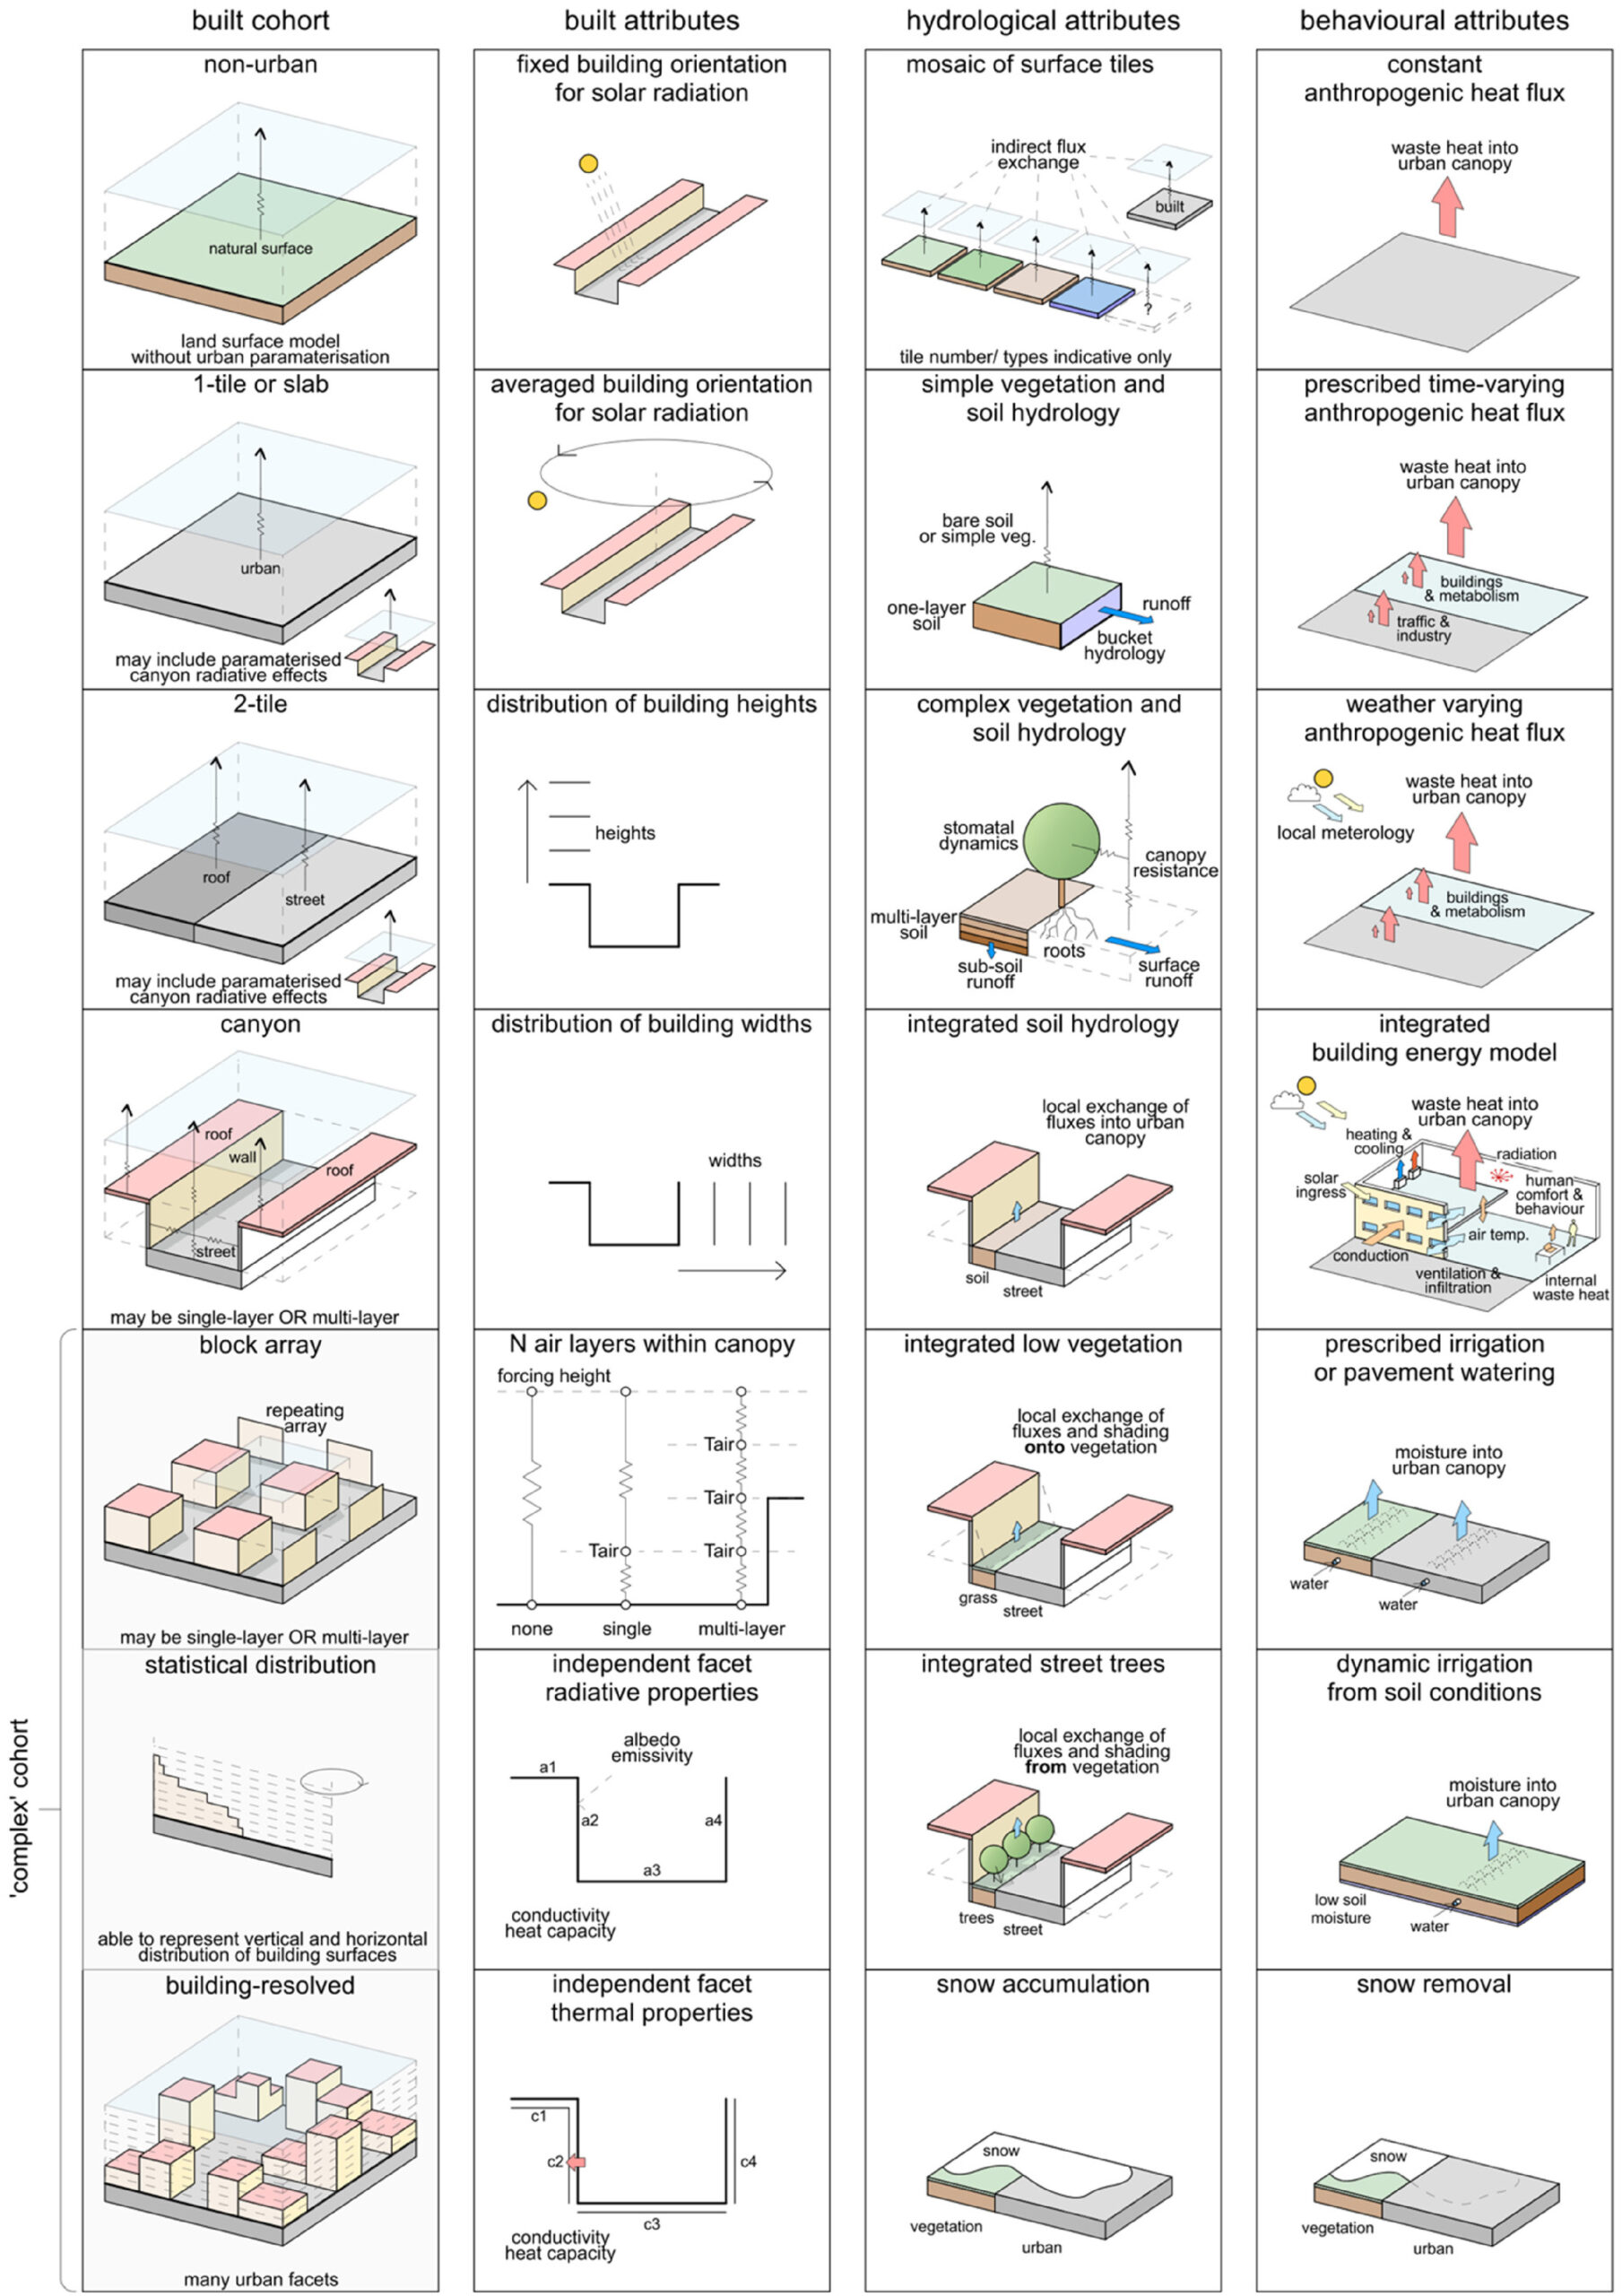
Abstract: Accurately predicting weather and climate in cities is critical for safeguarding human health and strengthening urban resilience. Multimodel evaluations can lead to model improvements; however, there have been no major intercomparisons of urban-focussed land surface models in over a decade. Here, in Phase 1 of the Urban-PLUMBER project, we evaluate the ability of 30 land surface models to simulate surface energy fluxes critical to atmospheric meteorological and air quality simulations. We establish minimum and upper performance expectations for participating models using simple information-limited models as benchmarks. Compared with the last major model intercomparison at the same site, we find broad improvement in the current cohort’s predictions of short-wave radiation, sensible and latent heat fluxes, but little or no improvement in long-wave radiation and momentum fluxes. Models with a simple urban representation (e.g., ‘slab’ schemes) generally perform well, particularly when combined with sophisticated hydrological/vegetation models. Some mid-complexity models (e.g., ‘canyon’ schemes) also perform well, indicating efforts to integrate vegetation and hydrology processes have paid dividends. The most complex models that resolve three-dimensional interactions between buildings in general did not perform as well as other categories. However, these models also tended to have the simplest representations of hydrology and vegetation. Models without any urban representation (i.e., vegetation-only land surface models) performed poorly for latent heat fluxes, and reasonably for other energy fluxes at this suburban site. Our analysis identified widespread human errors in initial submissions that substantially affected model performances. Although significant efforts are applied to correct these errors, we conclude that human factors are likely to influence results in this (or any) model intercomparison, particularly where participating scientists have varying experience and first languages. These initial results are for one suburban site, and future phases of Urban-PLUMBER will evaluate models across 20 sites in different urban and regional climate zones.
Fig. 1. Model schematics of the main built, hydrological and behavioural attributes for participating models. Here models are categorised into five cohorts (left column) based on the geometric representation of buildings, with built, hydrological and behavioural attributes used to refine a ‘total complexity’ (Figure 2). Block array, statistical distribution and building-resolved models are grouped together into a ‘complex’ cohort in later analysis.
Our new paper, “Impacts of climate change, population growth, and power sector decarbonization on urban building energy use“, is published in Nature Communications (IF: 16.6).
Authors: Chenghao Wang, Jiyun Song, Dachuan Shi, Janet L. Reyna, Henry Horsey, Sarah Feron, Yuyu Zhou, Zutao Ouyang, Ying Li, and Robert B. Jackson
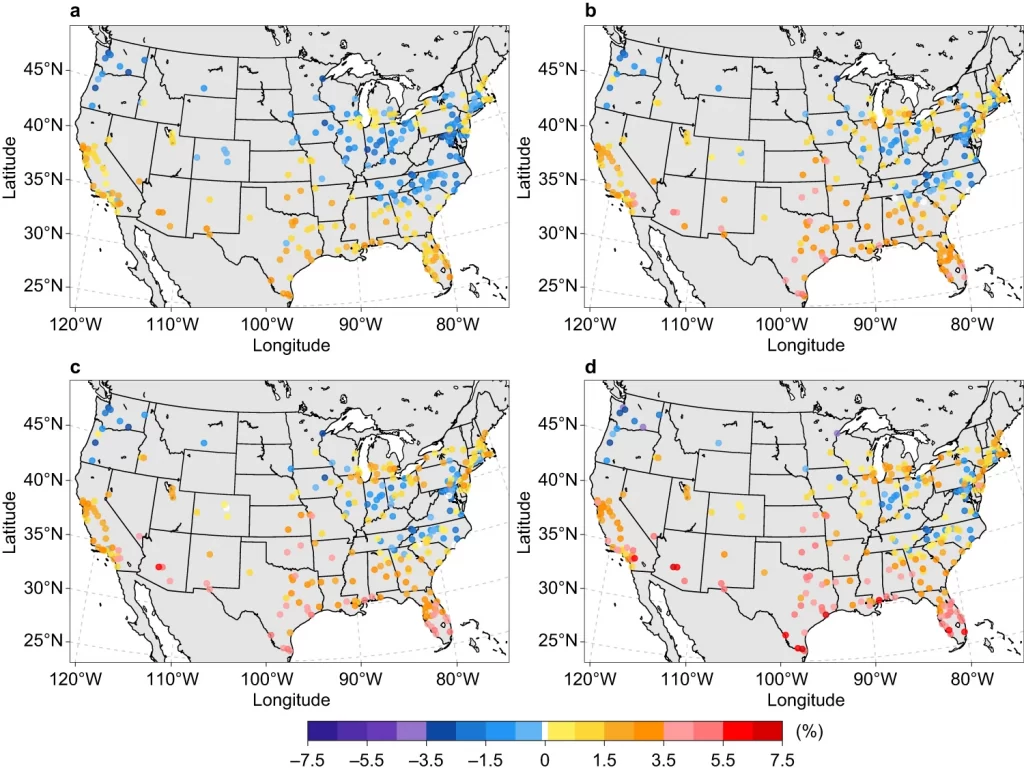
Abstract: Climate, technologies, and socio-economic changes will influence future building energy use in cities. However, current low-resolution regional and state-level analyses are insufficient to reliably assist city-level decision-making. Here we estimate mid-century hourly building energy consumption in 277 U.S. urban areas using a bottom-up approach. The projected future climate change results in heterogeneous changes in energy use intensity (EUI) among urban areas, particularly under higher warming scenarios, with on average 10.1–37.7% increases in the frequency of peak building electricity EUI but over 110% increases in some cities. For each 1 °C of warming, the mean city-scale space-conditioning EUI experiences an average increase/decrease of ~14%/ ~ 10% for space cooling/heating. Heterogeneous city-scale building source energy use changes are primarily driven by population and power sector changes, on average ranging from –9% to 40% with consistent south–north gradients under different scenarios. Across the scenarios considered here, the changes in city-scale building source energy use, when averaged over all urban areas, are as follows: –2.5% to –2.0% due to climate change, 7.3% to 52.2% due to population growth, and –17.1% to –8.9% due to power sector decarbonization. Our findings underscore the necessity of considering intercity heterogeneity when developing sustainable and resilient urban energy systems.
Fig. 1.a SSP1-2.6 scenario. b SSP2-4.5 scenario. c SSP3-7.0 scenario. d SSP5-8.5 scenario. Each point represents the relative change (%) based on the ensemble mean of the simulations driven by 10 CMIP6 models under each SSPX-Y scenario.