Our new paper, “A modeling framework to assess fenceline monitoring and self-reported upset emissions of benzene from multiple oil refineries in Texas“, is published in Atmospheric Environment X (IF: 3.8).
The paper and its supplement can be downloaded at https://www.sciencedirect.com/science/article/pii/S2590162124000480.
Authors: Qi Li, Lauren Padilla, Tammy Thompson, Shuolin Xiao, Elizabeth Mohr, Xiaohe Zhou, Nino Kacharava, Yuanfeng Cui, and Chenghao Wang
Abstract: Benzene as one type of hazardous air pollutants (HAPs) is produced by industrial production processes and/or emitted during upset events caused by man-made or natural accidents. Although upset emissions of benzene can be a significant contributor to the total emission, it is still challenging to quantify. This study first develops a fast modeling framework using obstacle-resolving computational fluid dynamics modeling to compare the modeled within-facility-scale passive pollutant dispersion with the observed levels based on self-reported emissions for fourteen facilities in Texas, United States. Results of numerical simulations demonstrate that neglecting the obstacle effect can underpredict (overpredict) the near-(far-)field concentrations for a low source. For a source located above obstacles, underprediction occurs at all distances. The diagnostic framework is applied to 107 self-reported upset emission events for fourteen petroleum refineries in Texas from year 2019–2022. Considering different metrics across all events, it can be concluded that the modeled concentrations based on self-reported emissions likely underpredict the observed concentration increments. Depending on the possible source height, the median factor of underprediction ranges from 3 to 95 based on the average-plume metric. The agreement between model and observation is better for events characterized by high emission amounts and rates, which also correspond to high observed concentration increments. Overall, the research highlights the importance of considering obstacles and demonstrates the potential application of the current approach as an efficient diagnostic method for self-reported upset emissions using fenceline observations of HAPs.
DOI: https://doi.org/10.1016/j.aeaoa.2024.100281
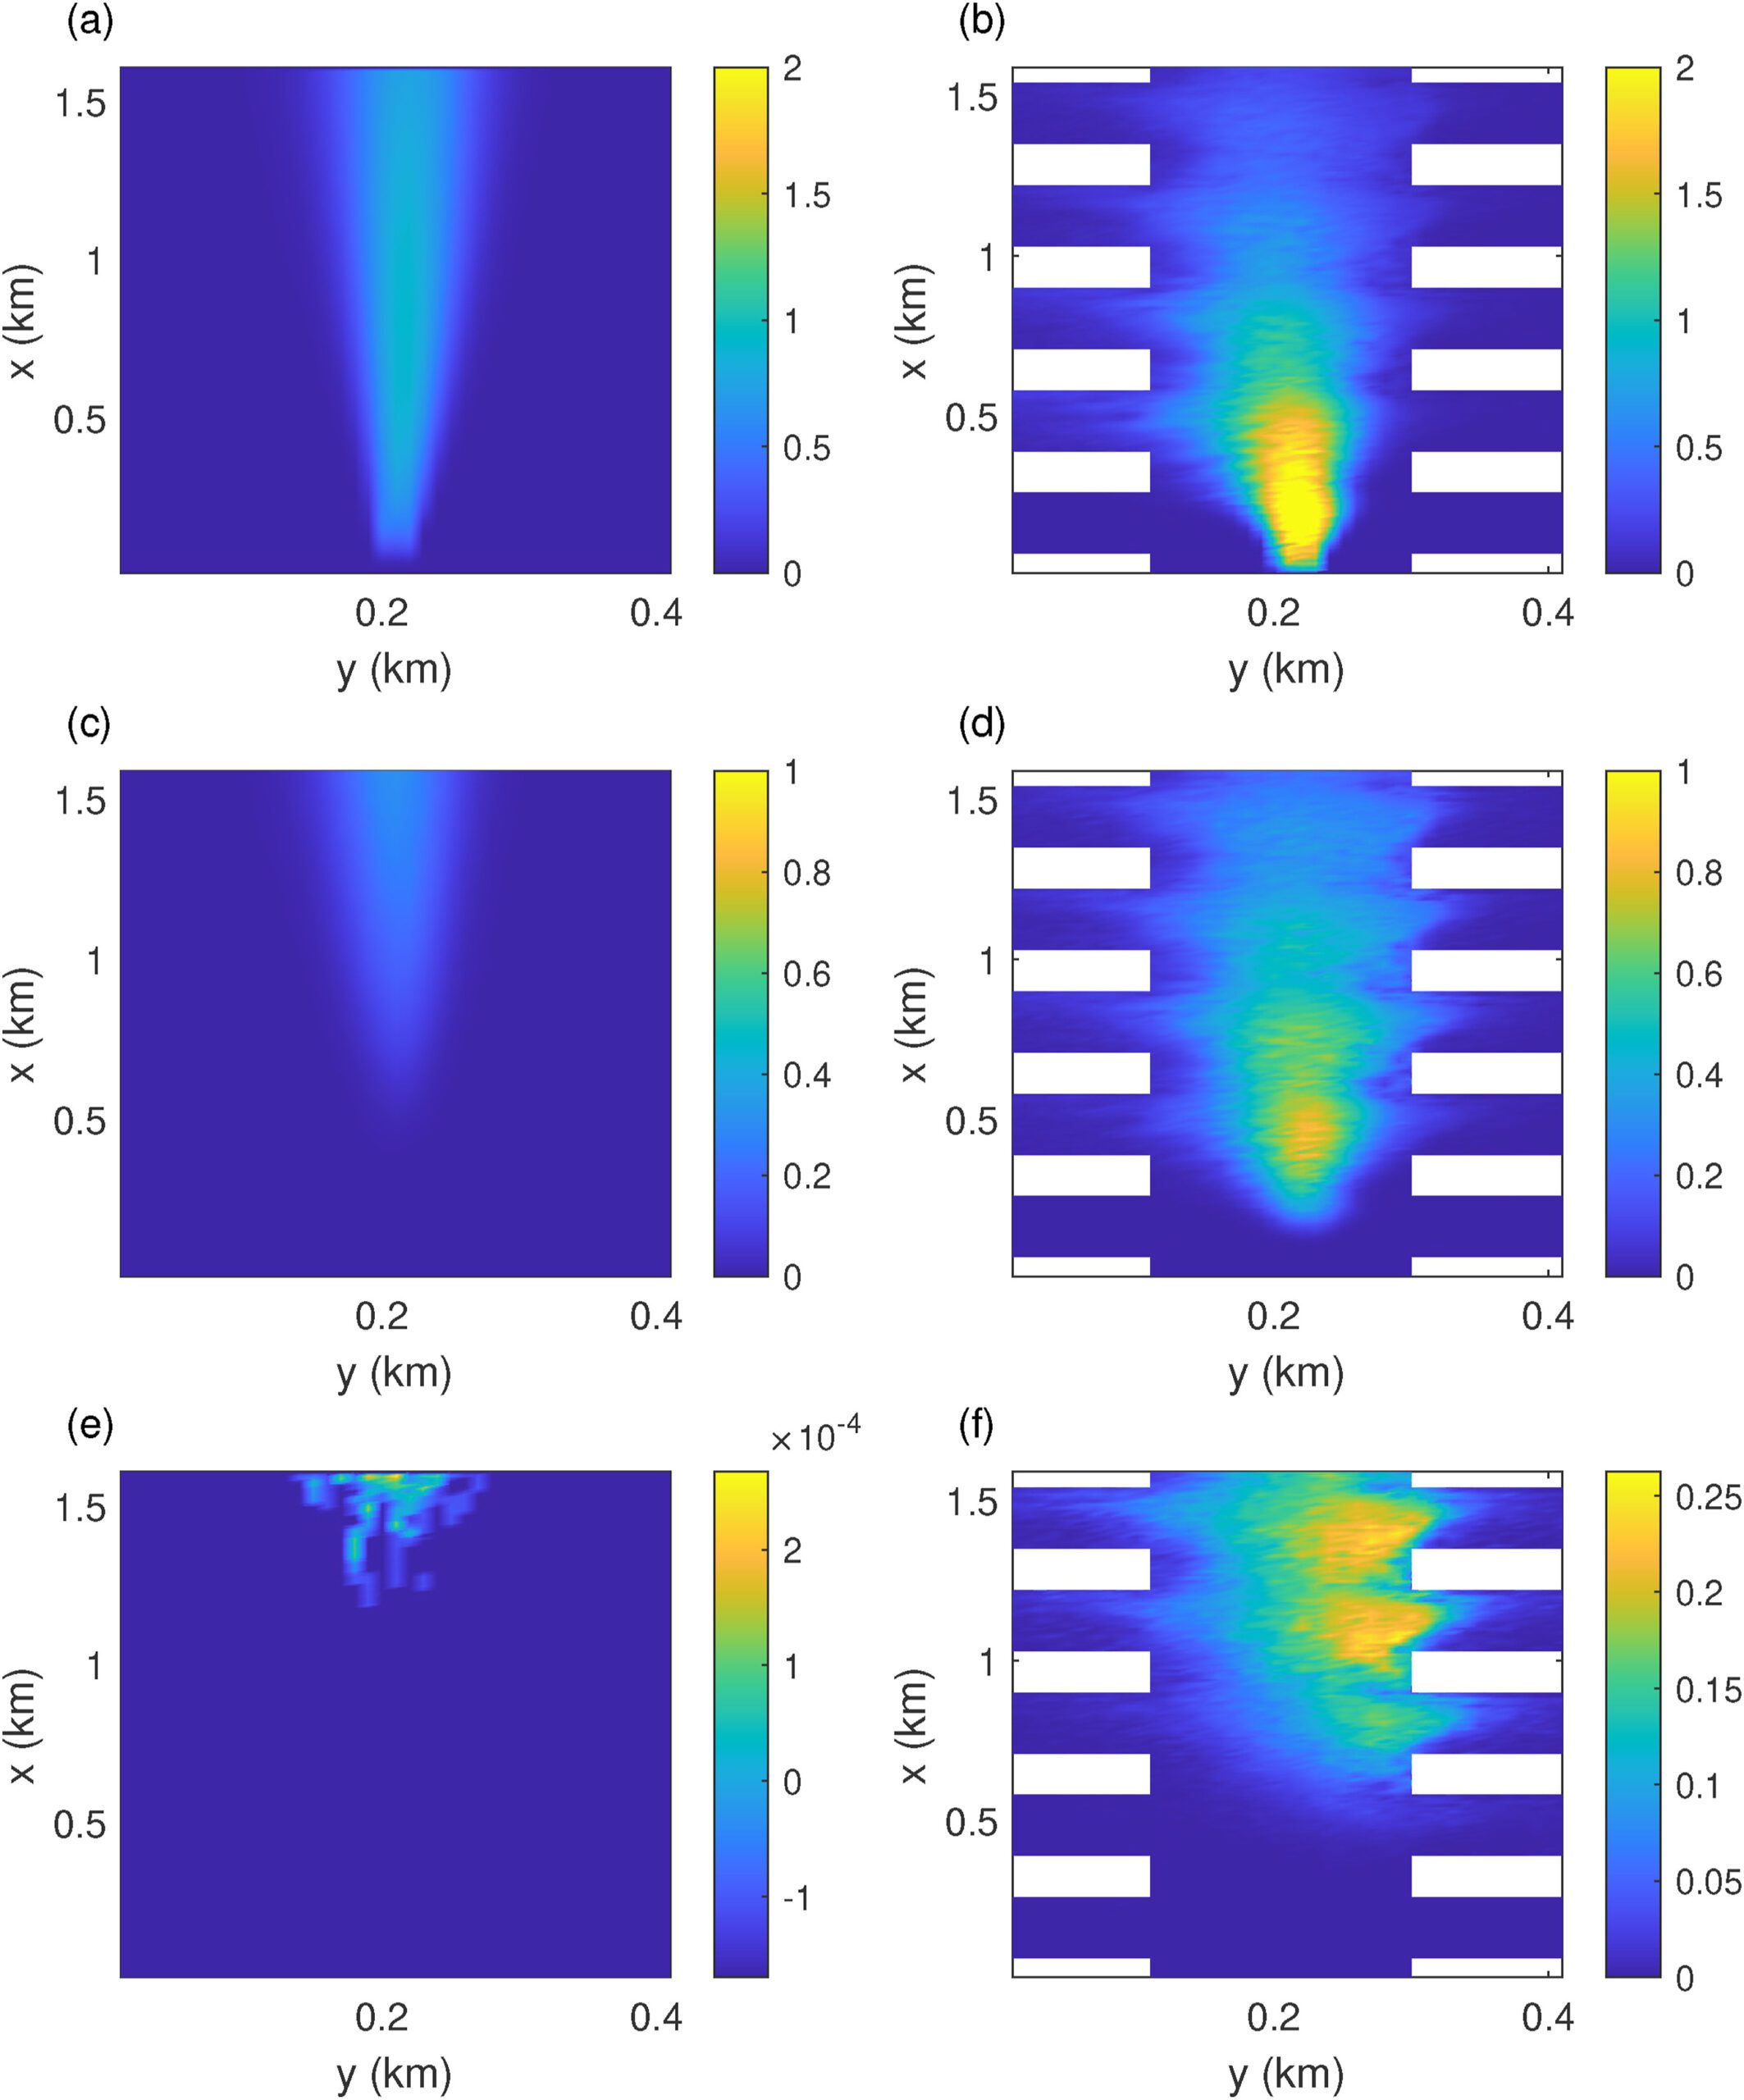
for cases without and with obstacles for horizontal plane at z = 2 m. The wind direction is zero degree, the obstacle geometry is sparse-low. The obstacles, i.e., the “white-bars” are 100 m × 100 m and the gap between, d, is 200 m in this example. The planar location of the source is indicated by the blue star in Fig. 1a; the top, middle, to bottom rows show cases with source heights corresponding to low, medium, and high as indicated in Fig. 1b. (a), (c), (e): C’LES for cases without obstacles with source heights zs low, medium and high. (b), (d), (f): C’LES for case with sparse-low obstacles with source heights zs low, medium and high.