@ The University of Oklahoma

Month: September 2024

New paper on urban land surface model intercomparison published in Journal of Advances in Modeling Earth Systems

Our new paper, “The water balance representation in Urban-PLUMBER land surface models“, is published in Journal of Advances in Modeling Earth Systems (IF: 4.4).

The paper can be downloaded at https://agupubs.onlinelibrary.wiley.com/doi/full/10.1029/2024MS004231.

Authors: H. J. Jongen, M. Lipson, A. J. Teuling, S. Grimmond, J.-J. Baik, M. Best, M. Demuzere, K. Fortuniak, Y. Huang, M. G. De Kauwe, R. Li, J. McNorton, N. Meili, K. Oleson, S.-B. Park, T. Sun, A. Tsiringakis, M. Varentsov, C. Wang, Z.-H. Wang, G. J. Steeneveld

Abstract: Urban Land Surface Models (ULSMs) simulate energy and water exchanges between the urban surface and atmosphere. However, earlier systematic ULSM comparison projects assessed the energy balance but ignored the water balance, which is coupled to the energy balance. Here, we analyze the water balance representation in 19 ULSMs participating in the Urban-PLUMBER project using results for 20 sites spread across a range of climates and urban form characteristics. As observations for most water fluxes are unavailable, we examine the water balance closure, flux timing, and magnitude with a score derived from seven indicators expecting better scoring models to capture the latent heat flux more accurately. We find that the water budget is only closed in 57% of the model-site combinations assuming closure when annual total incoming fluxes (precipitation and irrigation) are within 3% of the outgoing (all other) fluxes. Results show the timing is better captured than magnitude. No ULSM has passed all water balance indicators for any site. Models passing more indicators do not capture the latent heat flux more accurately refuting our hypothesis. While output reporting inconsistencies may have negatively affected model performance, our results indicate models could be improved by explicitly verifying water balance closure and revising runoff parameterizations. By expanding ULSM evaluation to the water balance and related to latent heat flux performance, we demonstrate the benefits of evaluating processes with direct feedback mechanisms to the processes of interest.

DOI: https://doi.org/10.1029/2024MS004231

Figure 8. Coefficient of determination (R2)
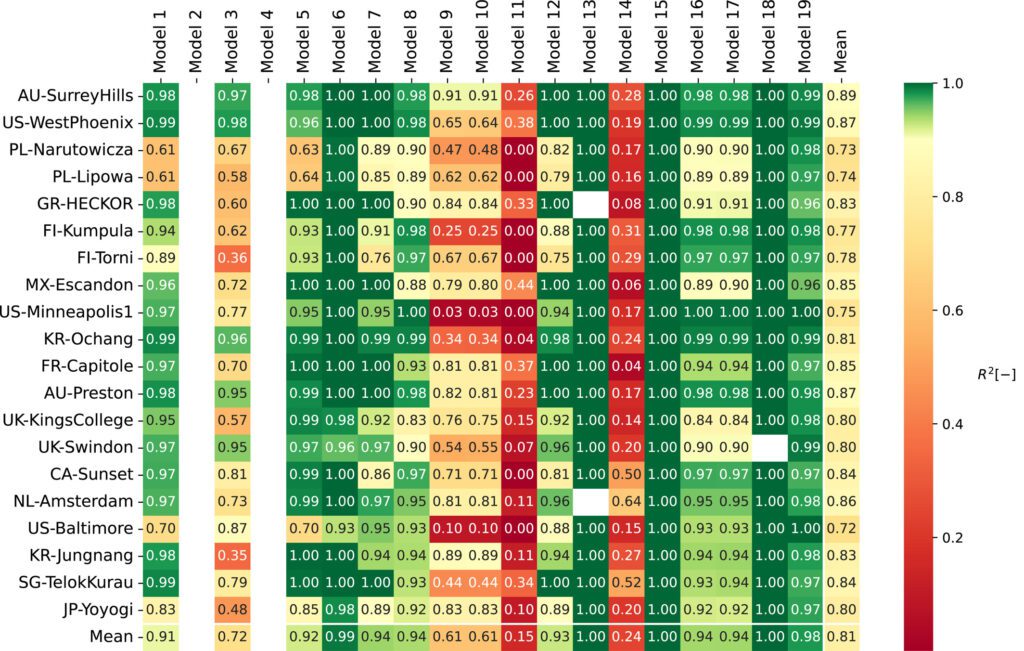
between (half-)hourly explicit and implicit water storage change by model and site. Green indicates the 0.9 IS,t threshold. Missing results are shown as white (i.e., cannot calculate explicit or implicit water storage change).

New paper on climate change in South America published in Communications Earth & Environment

Our new paper, “South America is becoming warmer, drier, and more flammable“, is published in Communications Earth & Environment (IF: 8.1).

The paper can be downloaded at https://www.nature.com/articles/s43247-024-01654-7.

Authors: Sarah Feron, Raúl R. Cordero, Alessandro Damiani, Shelley MacDonell, Jaime Pizarro, Katerina Goubanova, Raúl Valenzuela, Chenghao Wang, Lena Rester, Anne Beaulieu

Abstract: South America is experiencing severe impacts from climate change. Although the warming of the subcontinent closely follows the global path, the rise of temperatures has been more pronounced in some regions, which have also seen a parallel increment in the occurrence of droughts and weather conditions associated with enhanced fire risk. Here, we use reanalysis datasets to analyze the progression of the concurring warm, dry, and high fire risk conditions (i.e., dry compounds) since 1971. We show that the frequency of these compound extremes has surged in key South American regions including the northern Amazon, which have seen a 3-fold increase in the number of days per year with extreme fire weather conditions (including high temperatures, dryness, and low humidity). Our results also suggest that the surface temperature of the tropical Pacific Ocean modulates the interannual variability of dry compounds in South America. While El Niño enhances the fire risk in the northern Amazon, dry extremes in the Gran Chaco region appear to be more responsive to La Niña.

DOI: https://doi.org/10.1038/s43247-024-01654-7

Fig. 3: Dry compound extremes exhibit different regional and seasonal trends. Changes from 1971–2000 to 2001–2022 in the number of days per season with concurring warm, dry, and flammable conditions (i.e., dry compound days). The following meteorological seasons were considered: (a) December-January-February (DJF), (b) March-April-May (MAM), (c) June-July-August (JJA), and (d) September-October- November (SON). The number of dry compound days per season was derived (see “Methods”) from daily estimates from the ERA5 dataset over the period 1971–2022.

New paper on moisture tracking model comparisons published in Atmospheric Chemistry and Physics

Our new paper, “Unraveling the discrepancies between Eulerian and Lagrangian moisture tracking models in monsoon- and westerly-dominated basins of the Tibetan Plateau“, is published in Atmospheric Chemistry and Physics (IF: 5.2).

The paper can be downloaded at https://acp.copernicus.org/articles/24/10741/2024/.

Authors: Ying Li, Chenghao Wang, Qiuhong Tang, Shibo Yao, Bo Sun, Hui Peng, Shangbin Xiao

Abstract: Eulerian and Lagrangian numerical moisture tracking models, which are primarily used to quantify moisture contributions from global sources to specific regions, play a crucial role in hydrology and (paleo)climatology studies on the Tibetan Plateau (TP). Despite their widespread applications in the TP region, potential discrepancies in their moisture tracking results and their underlying causes remain unexplored. In this study, we compare the most widely used Eulerian and Lagrangian moisture tracking models over the TP, i.e., WAM2layers (the Water Accounting Model – 2 layers) and FLEXPART-WaterSip (the FLEXible PARTicle dispersion model coupled with the “WaterSip” moisture source diagnostic method), specifically focusing on a basin governed by the Indian summer monsoon (Yarlung Zangbo River basin, YB) and a westerly-dominated basin (upper Tarim River basin, UTB). Compared to the bias-corrected FLEXPART-WaterSip, WAM2layers generally estimates higher moisture contributions from westerly-dominated and distant sources but lower contributions from local recycling and nearby sources downwind of the westerlies. These differences become smaller with higher spatial and temporal resolutions of forcing data in WAM2layers. A notable advantage of WAM2layers over FLEXPART-WaterSip is its closer alignment of estimated moisture sources with actual evaporation, particularly in source regions with complex land–sea distributions. However, the evaporation biases in FLEXPART-WaterSip can be partly corrected through calibration with actual surface fluxes. For moisture tracking over the TP, we recommend using high-resolution forcing datasets, prioritizing temporal resolution over spatial resolution for WAM2layers, while for FLEXPART-WaterSip, we suggest applying bias corrections to optimize the filtering of precipitation particles and adjust evaporation estimates.

DOI: https://doi.org/10.5194/acp-24-10741-2024

Figure 3. Spatial distributions of moisture contributions (equivalent water height over source regions; mm) to precipitation in July 2022 in the (a, c) YB and (b, d) UTB simulated by (a, b) WAM2layers and (c, d) FLEXPART-WaterSip. Purple lines represent the TP boundary, and yellow lines represent the boundaries of the two representative basins. Red boxes in (d) delineate the eight source regions: northeastern Atlantic (NEA), midwestern Eurasia (MWE), northern Eurasia (NE), TP, Arabian Sea (AS), Bay of Bengal (BB), western Pacific (WP), and southern Indian Ocean (SIO).

New paper on surface temperature estimation published in Remote Sensing of Environment

Our new paper, “Improving estimation of diurnal land surface temperatures by integrating weather modeling with satellite observations“, is published in Remote Sensing of Environment (IF: 11.1).

The paper can be downloaded at https://www.sciencedirect.com/science/article/pii/S003442572400419X.

Authors: Wei Chen, Yuyu Zhou, Ulrike Passe, Tao Zhang, Chenghao Wang, Ghassem R. Asrar, Qi Li, Huidong Li

Abstract: Land surface temperature (LST) derived from satellite observations and weather modeling has been widely used for investigating Earth surface-atmosphere energy exchange and radiation budget. However, satellite-derived LST has a trade-off between spatial and temporal resolutions and missing observations caused by clouds, while there are limitations such as potential bias and expensive computation in model calibration and simulation for weather modeling. To mitigate those limitations, we proposed a WRFM framework to estimate LST at a spatial resolution of 1 km and temporal resolution of an hour by integrating the Weather Research and Forecasting (WRF) model and MODIS satellite data using the morphing technique. We tested the framework in eight counties, Iowa, USA, including urban and rural areas, to generate hourly LSTs from June 1st to August 31st, 2019, at a 1 km resolution. Upon evaluation with in-situ LST measurements, our WRFM framework has demonstrated its ability to capture hourly LSTs under both clear and cloudy conditions, with a root mean square error (RMSE) of 2.63 K and 3.75 K, respectively. Additionally, the assessment with satellite LST observations has shown that the WRFM framework can effectively reduce the bias magnitude in LST from the WRF simulation, resulting in a reduction of the average RMSE over the study area from 4.34 K (daytime) and 4.12 K (nighttime) to 2.89 K (daytime) and 2.75 K (nighttime), respectively, while still capturing the hourly patterns of LST. Overall, the WRFM is effective in integrating the complementary advantages of satellite observations and weather modeling and can generate LSTs with high spatiotemporal resolutions in areas with complex landscapes (e.g., urban).

DOI: https://doi.org/10.1016/j.rse.2024.114393

Fig. 9. The RMSE between the WRF simulated (A&C) and WRFM generated (B&D) LSTs according to MODIS observed LSTs at 11 am and 11 pm, respectively. The boundary of urban areas was marked in black.

Powered by WordPress & Theme by Anders Norén