Our new paper, “Unraveling the discrepancies between Eulerian and Lagrangian moisture tracking models in monsoon- and westerly-dominated basins of the Tibetan Plateau“, is published in Atmospheric Chemistry and Physics (IF: 5.2).
The paper can be downloaded at https://acp.copernicus.org/articles/24/10741/2024/.
Authors: Ying Li, Chenghao Wang, Qiuhong Tang, Shibo Yao, Bo Sun, Hui Peng, Shangbin Xiao
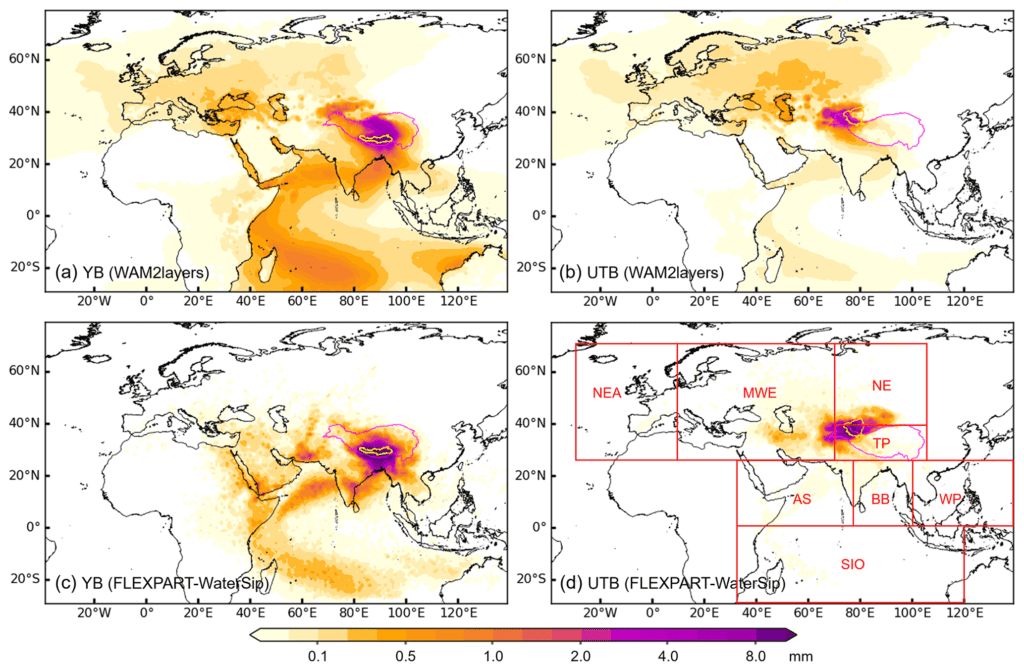
Abstract: Eulerian and Lagrangian numerical moisture tracking models, which are primarily used to quantify moisture contributions from global sources to specific regions, play a crucial role in hydrology and (paleo)climatology studies on the Tibetan Plateau (TP). Despite their widespread applications in the TP region, potential discrepancies in their moisture tracking results and their underlying causes remain unexplored. In this study, we compare the most widely used Eulerian and Lagrangian moisture tracking models over the TP, i.e., WAM2layers (the Water Accounting Model – 2 layers) and FLEXPART-WaterSip (the FLEXible PARTicle dispersion model coupled with the “WaterSip” moisture source diagnostic method), specifically focusing on a basin governed by the Indian summer monsoon (Yarlung Zangbo River basin, YB) and a westerly-dominated basin (upper Tarim River basin, UTB). Compared to the bias-corrected FLEXPART-WaterSip, WAM2layers generally estimates higher moisture contributions from westerly-dominated and distant sources but lower contributions from local recycling and nearby sources downwind of the westerlies. These differences become smaller with higher spatial and temporal resolutions of forcing data in WAM2layers. A notable advantage of WAM2layers over FLEXPART-WaterSip is its closer alignment of estimated moisture sources with actual evaporation, particularly in source regions with complex land–sea distributions. However, the evaporation biases in FLEXPART-WaterSip can be partly corrected through calibration with actual surface fluxes. For moisture tracking over the TP, we recommend using high-resolution forcing datasets, prioritizing temporal resolution over spatial resolution for WAM2layers, while for FLEXPART-WaterSip, we suggest applying bias corrections to optimize the filtering of precipitation particles and adjust evaporation estimates.
DOI: https://doi.org/10.5194/acp-24-10741-2024