@ The University of Oklahoma

Month: April 2025

New paper on WRF-LES methane plume modeling published in Journal of Geophysical Research: Atmospheres

Our new paper, “Observation and simulation of methane plumes during the morning boundary layer transition“, is published in Journal of Geophysical Research: Atmospheres (IF: 3.8).

The paper can be downloaded at https://agupubs.onlinelibrary.wiley.com/doi/full/10.1029/2024JD042317.

Authors: Xiao-Ming Hu, Wesley Honeycutt, Chenghao Wang, Binbin Weng, Bowen Zhou, & Ming Xue

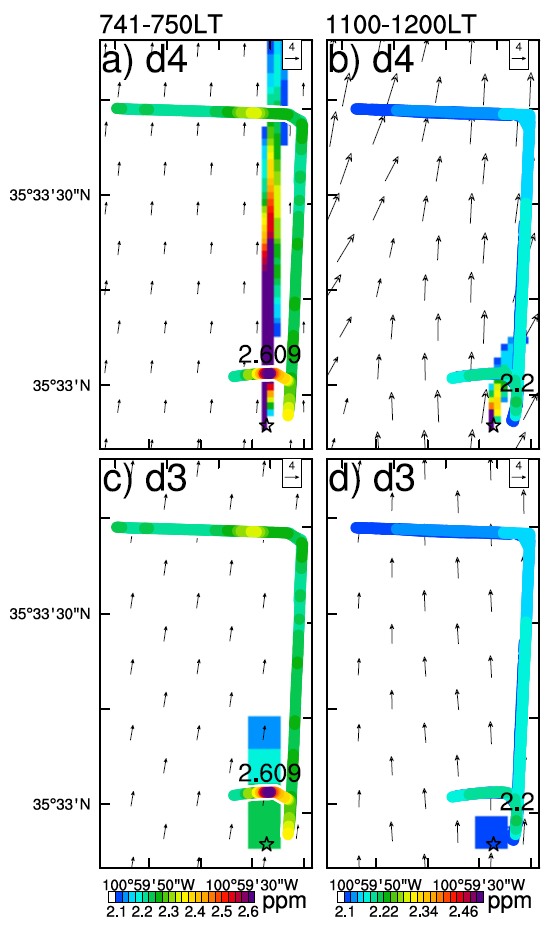
Abstract: Methane (CH4) contributes significantly to global warming. However, accurate identification of CH4 sources for reducing CH4 emissions is often hampered by inadequate accuracy and spatiotemporal coverage of CH4 detection, and lack of accurate CH4 forward modeling used in top-down inversion systems. In this study, a field experiment was conducted in Pampa, Texas using two CH4 sensors (LI-COR and OGI camera) to detect CH4 releases. We investigated whether high-resolution simulations using the Weather Research and Forecasting (WRF) model with greenhouse gases (WRF-GHG) could accurately simulate the CH4 plumes in the presence of evolving atmospheric boundary layer from sunrise to noon. CH4 plumes showed substantial variation in time. At a release rate of ∼17.5 kg hr−1, the maximum enhancement of CH4 measured by LI-COR was 2.6 ppm at sunrise (7:36 a.m.), 250 m from the release location. Within half an hour after sunrise, this enhancement decreased to 0.3–0.4 ppm. The enhancement was 0.2 ppm by 10:00 a.m. and further dropped to less than 0.1 ppm after 11:30 a.m. Due to the low temperature at sunrise, the OGI camera failed to detect the CH4 plume. The WRF-GHG large-eddy simulation (LES) with 32 m grid spacing successfully reproduced these CH4 enhancements. In situ measurements together with numerical simulations illustrate the impact of the transition from a stable boundary layer in the early morning to a convective boundary layer at noon on the dispersion of CH4 plumes. Additionally, CH4 plumes from a cattle farm in Oklahoma are briefly examined using the same modeling approach.

DOI: https://doi.org/10.1029/2024JD042317

Fig. 3. Simulated CH4 mixing ratios and wind vectors (reference vector of 4 m s−1 marked in top‐right corners) in domain (a), (b) 4 and (c), (d) 3 overlaid with observed mixing ratios along the driving routes during (left) sunrise and (right) noon time. The numbers are the observed maximum mixing ratios at the time period.

Liam Thompson named a 2025 Goldwater Scholar

Liam Thompson was recently selected as the 2025 Goldwater Scholar. His essay was based on the continental-scale model evaluation work recently published in Urban Climate.

The Goldwater Foundation is a federally endowed agency established by Public Law 99-661 on November 14, 1986. The Scholarship Program honoring Senator Barry Goldwater was designed to identify, encourage, and financially support outstanding undergraduates interested in pursuing research careers in the sciences, engineering, and mathematics. The Goldwater Scholarship is the preeminent undergraduate award of its type in these fields.

From an estimated pool of over 5,000 college sophomores and juniors, 1,350 science, engineering, and mathematics students were nominated by 445 academic institutions to compete for the 2025 Goldwater scholarships. The Trustees of the Goldwater Board awarded 441 Goldwater scholarships to college students from across the United States for the 2025-2026 academic year. With the 2025 awards, the Goldwater Foundation has awarded 11,162 scholarships since 1989, the first year the scholarship was bestowed.

The official press release is here: https://goldwaterscholarship.gov/

Congratulations, Liam!

Department of Geography and Environmental Sustainability News

New paper on continental-scale urban hydroclimate modeling evaluation published in Urban Climate

Our new paper, “Assessment of convection-permitting hydroclimate modeling in urban areas across the contiguous United States“, is published in Urban Climate (IF: 6.0). This work was led by undergraduate student Liam Thompson. Congratulations, Liam!

The paper can be downloaded at https://www.sciencedirect.com/science/article/pii/S2212095525000914.

Authors: Liam Thompson, Chenghao Wang, Cenlin He, Tzu-Shun Lin, Changhai Liu, and Jimy Dudhia

Abstract: Accurate representation of urban areas in weather and climate models is crucial for simulating interactions between urban surfaces and the atmospheric boundary layer, especially in high-resolution regional models that resolve deep convection. However, many continental-scale simulations use simplified urban parameterizations, raising questions about their ability to reproduce urban hydroclimate. This study evaluates CONUS404—a recent USGS-NCAR 4-km convection-permitting hydroclimate modeling dataset—in urban areas across the contiguous United States (CONUS). We assessed hourly near-surface air temperature, dewpoint, and wind speed simulations at 208 urban and 342 non-urban station locations from 2011 to 2020 using observations. Results show that CONUS404 performs better for air temperature in urban areas, with a slight mean warm bias (0.08 °C) at urban stations and a mean cold bias (−0.52 °C) at non-urban stations. Dewpoint simulations exhibit stronger dry biases at urban stations, suggesting underrepresented evapotranspiration from urban vegetation. Wind speed is generally underestimated, with average biases of −0.74 m s−1 at urban and −0.35 m s−1 at non-urban stations. Seasonal analyses reveal larger model errors for wintertime temperature and dewpoint that strongly depend on urban fraction. These findings highlight the limitations of the bulk urban parameterization in CONUS404, underscoring the need for enhanced urban representations to improve continental-scale hydroclimate simulations.

DOI: https://doi.org/10.1016/j.uclim.2025.102375

Fig. 9. Dependence of (a–c) MAE and (d–f) MBE for modeled hourly near-surface air temperature (a, d), dewpoint (b, e), and wind speed (c, f) on urban fraction across 208 urban grids. A linear or multi-linear regression line is fitted to the mean MAE and MBE of each plot, using the higher R2 of the fitted model. Each boxplot contains 40–43 urban grids/station locations. An F-test was performed to determine the overall goodness of fit of the model. N.S. indicates not significant, while *, **, and *** denote statistically significant with p < 0.05, 0.01, and 0.001, respectively. The box denotes the interquartile range (IQR) that represents the distribution of CONUS404 errors between the upper and lower quartiles, the whiskers represent the distribution of errors ±1.5 × IQR, and points outside the core box and whiskers are outliers.

Powered by WordPress & Theme by Anders Norén