Cathleen Simatupang recently joined the Sustainable URban Futures (SURF) Lab as a postdoctoral researcher. Welcome!
Before coming to OU, Cathleen completed her dual Ph.D. degrees in Environmental and Water Resources Engineering from Mahidol University, Thailand, and in Natural Sciences from Macquarie University, Australia. Her doctoral research focused on environmental pollution, particularly soil contamination, PM2.5 air pollution, and heavy metal exposure in both air and soil, with an emphasis on health risk assessments. She also examined how outdoor air pollution affects indoor air quality, especially in a semi-open learning environment such as a childcare center.
Her postdoctoral research will focus on the measurement and modeling of urban meteorology and air pollution.
Our new paper, “Enhancing climate-driven urban tree cooling with targeted nonclimatic interventions“, is published in Environmental Science & Technology (IF: 10.9).
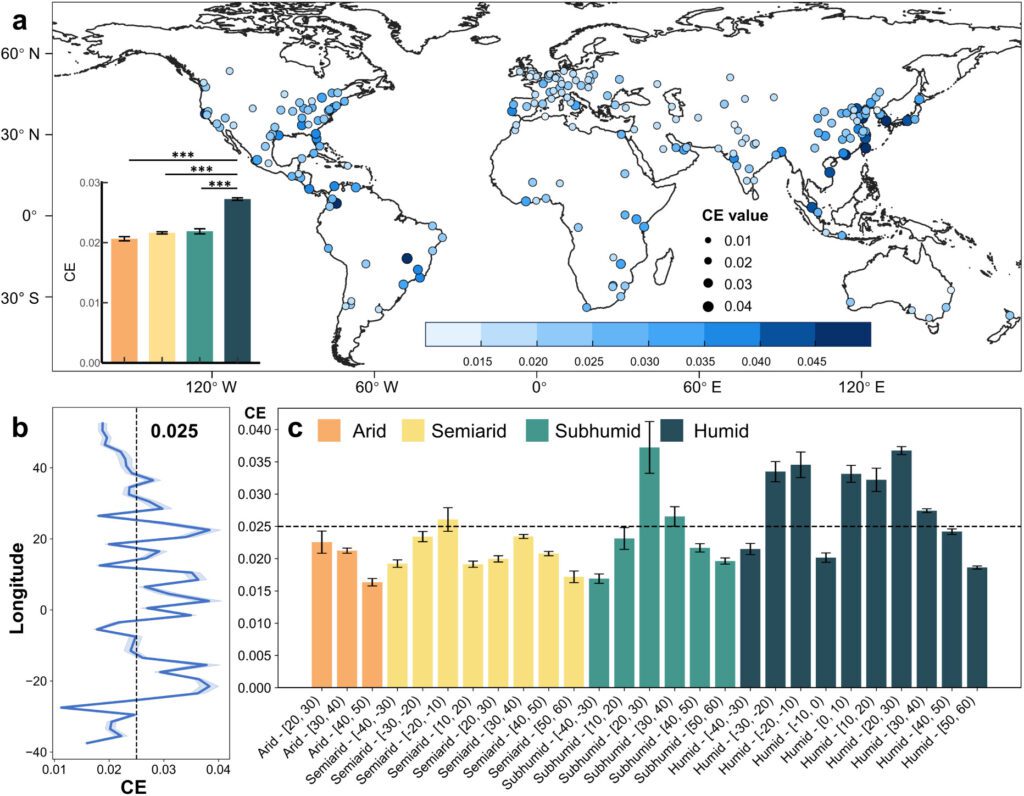
Abstract: Urban trees play a pivotal role in mitigating heat, yet the global determinants and patterns of their cooling efficiency (CE) remain elusive. Here, we quantify the diel CE of 229 cities across four climatic zones and employ a machine-learning model to assess the influence of variables on CE. We found that for every 10% increase in tree cover, surface temperatures are reduced by 0.25 °C during the day and 0.04 °C at night. Trees in humid regions exhibit the highest daytime CE, while those in arid zones demonstrate the greatest cooling effect at night. This can be explained by the difference in canopy density between the humid and arid zones. During the day, the high canopy density in the humid zone converts more solar radiation into latent heat flux. At night, the low canopy density in the arid zone intercepts less longwave radiation, which favors surface cooling. While climatic factors contribute nearly twice as much to CE as nonclimatic ones, our findings suggest that optimizing CE is possible by managing variables within specific thresholds due to their nonlinear effects. For instance, we revealed that in arid regions, an impervious surface coverage of approximately 60% is optimal, whereas in humid areas, reducing it to around 40% maximizes cooling benefits. These insights underscore the need for targeted management of nonclimatic factors to sustain tree cooling benefits and offer practical guidance for designing climate-resilient, nature-based urban strategies.
Figure 1. Global patterns of daytime cooling efficiency (CE) of urban trees. (a) Spatial distribution of daytime CE for selected cities. Each point represents the mean CE value of all urban cells within a city. Inset histograms display the mean daytime CE values (means ± s.e.) for arid (n = 636), semiarid (n = 2784), subhumid (n = 772), and humid (n = 5438) climate zones. Statistical analysis was performed using Welch’s ANOVA, followed by the Games-Howell post hoc test for multiple comparisons. Asterisks indicate significant differences between two climate zones (*p < 0.05, **p < 0.01, ***p < 0.001). (b) Latitudinal variation of daytime CE across all urban cells. The graph shows mean CE values for two-degree latitude intervals, with the shaded area indicating 1 s.e., and the dotted line representing the global mean of all urban cells. (c) Latitudinal distribution of daytime CE across climate zones. Each bar represents mean CE values (means ± s.e.) within the specified latitude range for each climate zone.
Our new paper, “Satellite-driven evidence of forest-induced temperature variability and its biophysical and biogeochemical pathways across latitudes“, is published in Ecological Indicators (IF: 7.0).
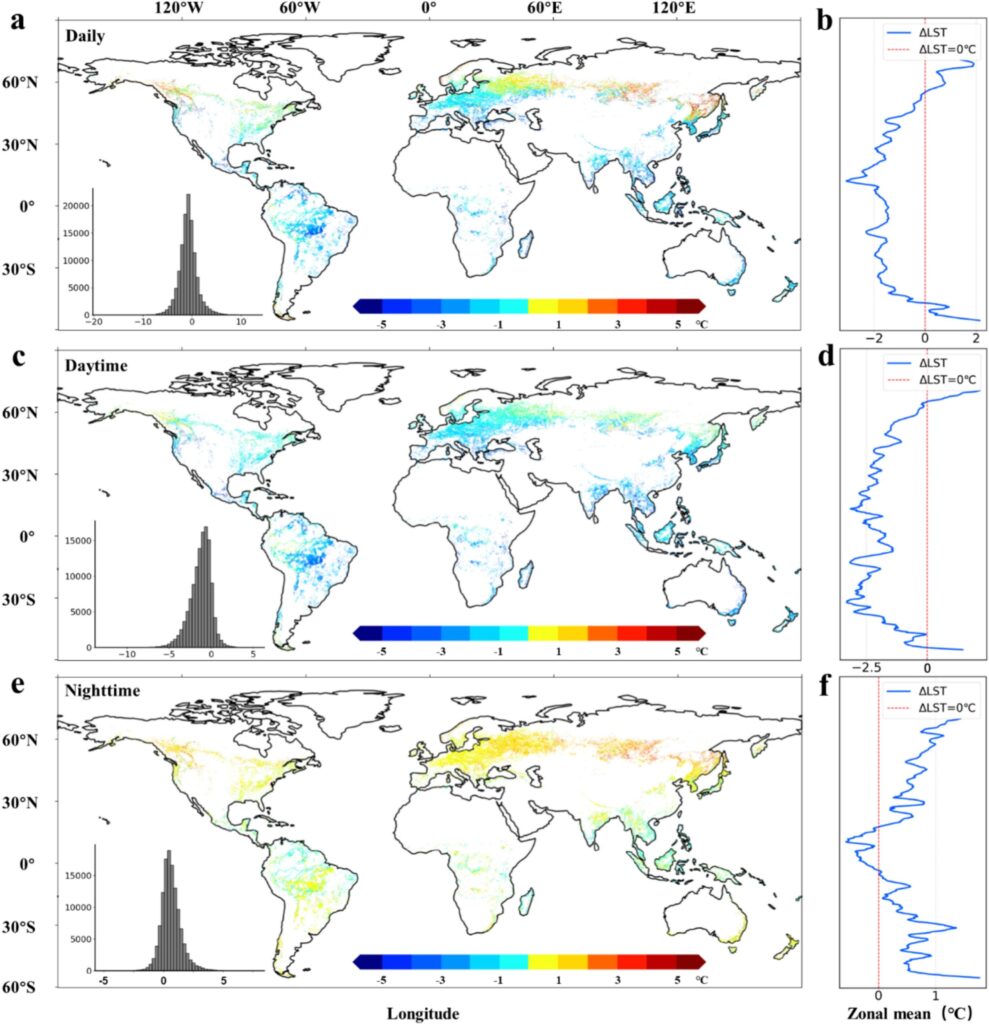
Abstract: Forests significantly influence local temperature dynamics, although the specifics of their impacts and mechanisms exhibit global variability. This study investigates the cooling or warming effects of global forests from 2001 to 2021 using multi-satellite data. The results indicate that (1) boreal forests exhibit a significant warming effect of +1.99 °C. Temperate forests exhibit nighttime warming but notable daytime cooling effect, resulting in a net daily cooling effect (−0.48 °C in the northern hemisphere, −0.91 °C in the southern hemisphere). The daily cooling effects peak in summer and gradually rise from spring to autumn, with winter exhibiting a warming inclination. Tropical forests consistently provide a cooling effect year-round (−2.11 °C). (2) Over the study period, tropical forests consistently revealed robust and stable cooling effects. Temperate forests displayed modest fluctuations in cooling effects, while the warming effect of boreal forest showed a slow trend upwards at a rate of +0.03 °C per year. (3) The warming effect of boreal forests is primarily due to NEE (net ecosystem exchange) and ET pathways (indirect effect: +0.253 and +0.392), while tropical forest cooling is driven by increased evapotranspiration (indirect effect: −0.938). As for temperate zones, annual cooling is primarily led by the NEE pathway (NH: −0.055 and SH: −0.415). (4) A robust annual coherence emerges between forests’ temperature regulation effects and ΔNEE, ΔET, and Δalbedo, where augmented ET and albedo significantly amplify cooling effects synchronously. The decrease in NEE exhibits a positive but non-synchronous impact on cooling at the local scale, while showing a strong and synchronous relationship with ΔLST at the global scale. These findings highlight the crucial role of forests in local temperature regulation, necessitating targeted management strategies.
Fig. 3. Global distribution and latitudinal trend of ΔLST. It showcases the spatial distribution (a, c, e) and latitudinal patterns (b, d, f) of ΔLST (°C) for the entire year during the daily average (a, b), daytime (c, d), and nighttime (e, f). The histograms located at the lower left corner of figures a, c, and e illustrate the concentrated distribution of ΔLST values across all sample windows.