Our new paper, “Satellite-driven evidence of forest-induced temperature variability and its biophysical and biogeochemical pathways across latitudes“, is published in Ecological Indicators (IF: 7.0).
The paper can be downloaded at https://www.sciencedirect.com/science/article/pii/S1470160X25004753.
Authors: Zhaowu Yu, Mingchuan Shao, Wenjuan Ma, Chenghao Wang, & Jiachuan Yang
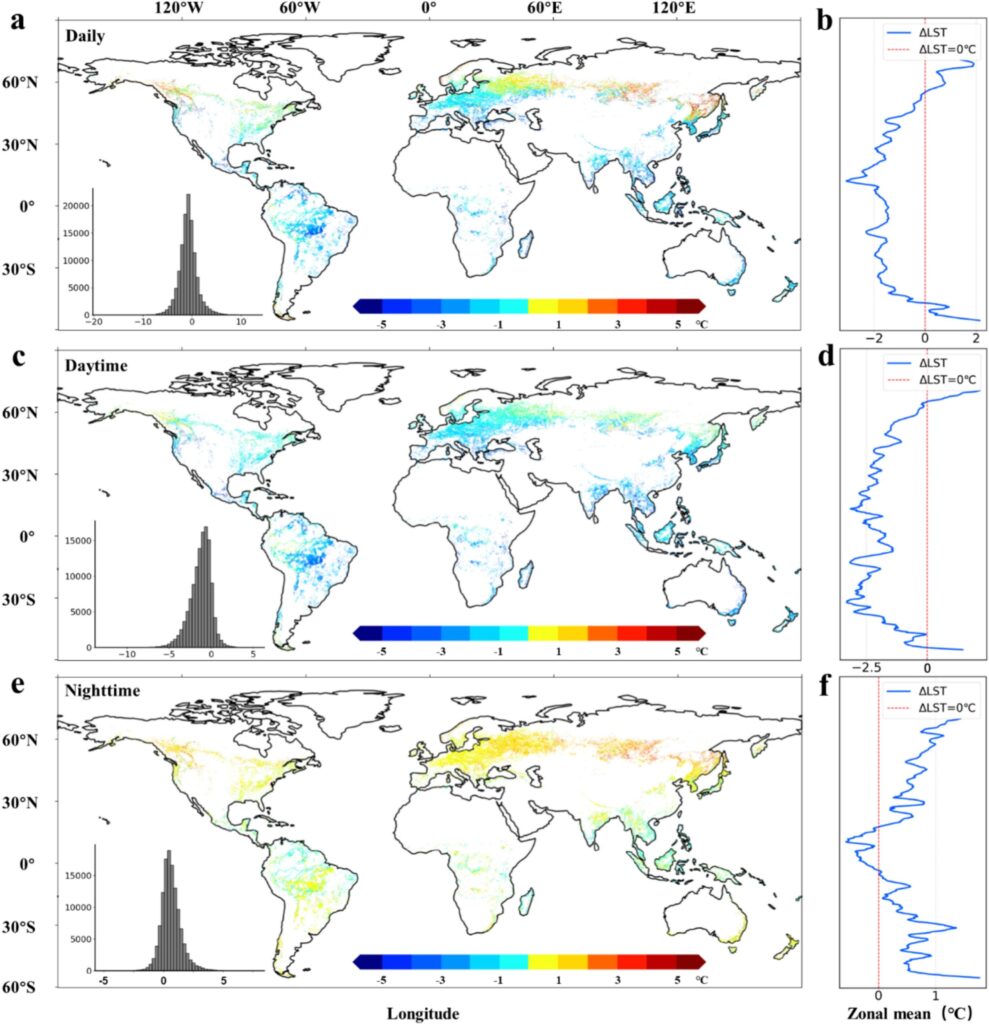
Abstract: Forests significantly influence local temperature dynamics, although the specifics of their impacts and mechanisms exhibit global variability. This study investigates the cooling or warming effects of global forests from 2001 to 2021 using multi-satellite data. The results indicate that (1) boreal forests exhibit a significant warming effect of +1.99 °C. Temperate forests exhibit nighttime warming but notable daytime cooling effect, resulting in a net daily cooling effect (−0.48 °C in the northern hemisphere, −0.91 °C in the southern hemisphere). The daily cooling effects peak in summer and gradually rise from spring to autumn, with winter exhibiting a warming inclination. Tropical forests consistently provide a cooling effect year-round (−2.11 °C). (2) Over the study period, tropical forests consistently revealed robust and stable cooling effects. Temperate forests displayed modest fluctuations in cooling effects, while the warming effect of boreal forest showed a slow trend upwards at a rate of +0.03 °C per year. (3) The warming effect of boreal forests is primarily due to NEE (net ecosystem exchange) and ET pathways (indirect effect: +0.253 and +0.392), while tropical forest cooling is driven by increased evapotranspiration (indirect effect: −0.938). As for temperate zones, annual cooling is primarily led by the NEE pathway (NH: −0.055 and SH: −0.415). (4) A robust annual coherence emerges between forests’ temperature regulation effects and ΔNEE, ΔET, and Δalbedo, where augmented ET and albedo significantly amplify cooling effects synchronously. The decrease in NEE exhibits a positive but non-synchronous impact on cooling at the local scale, while showing a strong and synchronous relationship with ΔLST at the global scale. These findings highlight the crucial role of forests in local temperature regulation, necessitating targeted management strategies.
DOI: https://doi.org/10.1016/j.ecolind.2025.113545