Our new paper, “Enhancing climate-driven urban tree cooling with targeted nonclimatic interventions“, is published in Environmental Science & Technology (IF: 10.9).
The paper can be downloaded at https://pubs.acs.org/doi/10.1021/acs.est.4c14275.
Authors: Zhaowu Yu, Siheng Li, Wenjun Yang, Jiquan Chen, Mohammad A. Rahman, Chenghao Wang, Wenjuan Ma, Xihan Yao, Junqi Xiong, Chi Xu, Yuyu Zhou, Jike Chen, Kangning Huang, Xiaojiang Gao, Rasmus Fensholt, Qihao Weng, & Weiqi Zhou
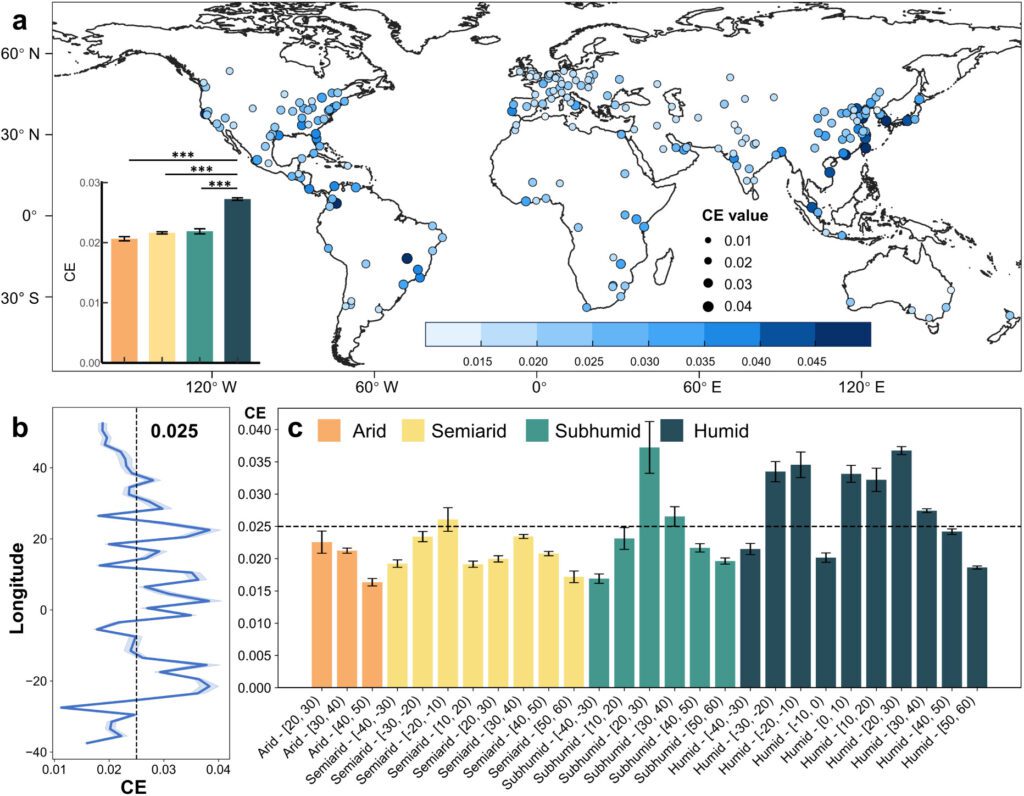
Abstract: Urban trees play a pivotal role in mitigating heat, yet the global determinants and patterns of their cooling efficiency (CE) remain elusive. Here, we quantify the diel CE of 229 cities across four climatic zones and employ a machine-learning model to assess the influence of variables on CE. We found that for every 10% increase in tree cover, surface temperatures are reduced by 0.25 °C during the day and 0.04 °C at night. Trees in humid regions exhibit the highest daytime CE, while those in arid zones demonstrate the greatest cooling effect at night. This can be explained by the difference in canopy density between the humid and arid zones. During the day, the high canopy density in the humid zone converts more solar radiation into latent heat flux. At night, the low canopy density in the arid zone intercepts less longwave radiation, which favors surface cooling. While climatic factors contribute nearly twice as much to CE as nonclimatic ones, our findings suggest that optimizing CE is possible by managing variables within specific thresholds due to their nonlinear effects. For instance, we revealed that in arid regions, an impervious surface coverage of approximately 60% is optimal, whereas in humid areas, reducing it to around 40% maximizes cooling benefits. These insights underscore the need for targeted management of nonclimatic factors to sustain tree cooling benefits and offer practical guidance for designing climate-resilient, nature-based urban strategies.
DOI: https://doi.org/10.1021/acs.est.4c14275