@ The University of Oklahoma

Month: September 2025

New paper on improved urban canopy model published in Building and Environment

Our new paper, “Multi-parameterization of hydrological processes in an urban canopy model“, is published in Building and Environment (IF: 7.6).

The paper can be downloaded at https://www.sciencedirect.com/science/article/abs/pii/S036013232501039X.

Authors: Yuqi Huang, Chenghao Wang, & Zhi-Hua Wang

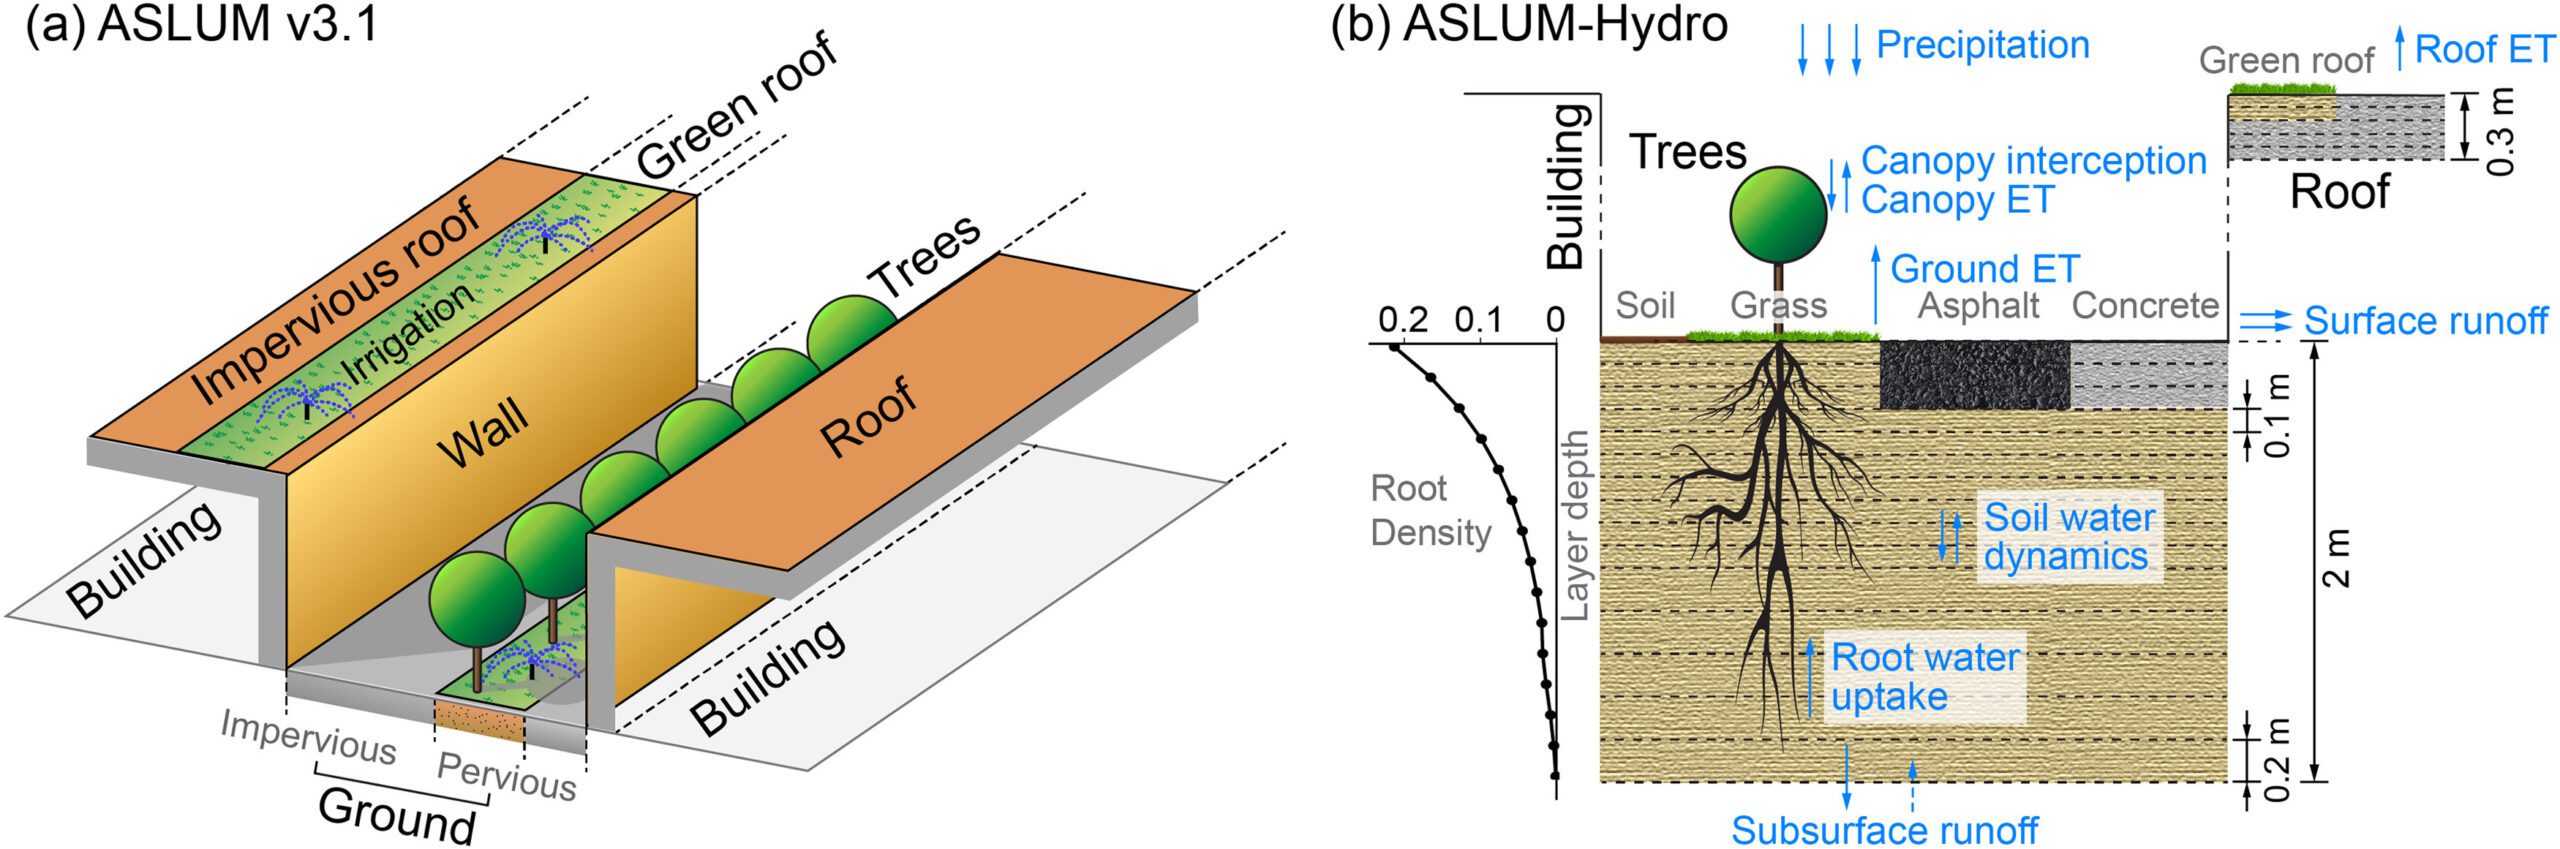
Abstract: Accurately representing urban hydrological processes is essential for understanding energy and water exchanges in cities, improving weather and climate simulations across scales, and informing effective flood and water resource management. Despite recent advancements in urban land surface modeling, many models still struggle to achieve a closed water balance and rely on oversimplified representation of hydrological processes. These issues primarily stem from the inherent complexity and heterogeneity of the urban hydrologic cycle. In this study, we integrated multiple hydrological parameterization schemes into a single-layer urban canopy model to better capture key processes such as canopy interception, surface runoff, soil moisture dynamics, and groundwater runoff. These new schemes enhance the model’s existing capabilities of resolving root water uptake and evapotranspiration. Evaluation against short-term, single-site observations shows that the proposed model improves the accuracy of surface energy and water partitioning, with RMSE reductions of 8 % for urban latent heat flux, 7 % for sensible heat flux, and 12 % for net radiation compared to the previous version. We further evaluated the influence of initial soil moisture on model performance and the cooling effect of urban trees. Results reveal that urban trees can either cool or warm the street canyon air depending on soil moisture availability. While shading effectively lowers ground surface temperature, evaporative cooling primarily reduces canyon air temperatures. Our findings underscore the importance of incorporating detailed hydrological processes into urban climate models, with broad implications for city planning, public health, and sustainable development efforts aimed at mitigating urban heat stress and water-related risks.

DOI: https://doi.org/10.1016/j.buildenv.2025.113567

Fig. 1. Schematic structures of (a) ASLUM v3.1 and (b) ASLUM-Hydro. Major hydrological processes are shown in blue in (b) to emphasize the focus of ASLUM-Hydro improvements.

New paper on heavy metal imprints in Antarctic snow published in Nature Sustainability

Our new paper, “Heavy metal imprints in Antarctic snow from research and tourism“, is published in Nature Sustainability (IF: 27.1).

The paper can be downloaded at https://www.nature.com/articles/s41893-025-01616-7.

Authors: Raúl R. Cordero, Sarah Feron, Avni Malhotra, Alessandro Damiani, Minghu Ding, Francisco Fernandoy, Juan A. Alfonso, Belkis Garcia, Juan M. Carrera, Pedro Llanillo, Paul Wachter, Jaime Pizarro, Elise Roumeas, Edgardo Sepúlveda, Jose Jorquera, Chenghao Wang, Jorge Carrasco, Zutao Ouyang, Pedro Oyola, Maarten Loonen, Anne Beaulieu, Jacob Dana, Alia L. Khan, Gino Casassa, & Choong-Min Kang

Abstract: Antarctica, long regarded as one of the last pristine environments on Earth, is increasingly affected by human activity. As tourism surges and scientific operations expand, air pollution from local emissions is raising new environmental concerns. Here we analyse surface snow samples collected along a ~2,000-km transect, from the South Shetland Islands (62° S) to the Ellsworth Mountains (79° S), to map the geochemical fingerprints of aerosol deposition. We identify distinct spatial patterns shaped by crustal, marine, biogenic and anthropogenic sources. Notably, we detect heavy metal imprints in the snow chemistry of the northern Antarctic Peninsula, where major research stations are concentrated and marine tourism traffic is most intense. Our findings shed light on the extent of the impacts from energy-intensive local activities in Antarctica, underscoring the need for enhanced environmental monitoring and sustainable management strategies in this fragile region.

DOI: https://doi.org/10.1038/s41893-025-01616-7

Fig. 2 | Snow chemistry across our sampling sites exhibit both natural and anthropogenic markers. a, Snow sampling sites. Colours represent the clusters identified by applying PCA to the element concentrations. Sampling was conducted at 16 sites, marked by consecutive numbers. We sampled across the South Shetland Islands (King George Island, Robert Island, Greenwich Island, Half Moon Island, Livingston Island and Deception Island) and the Palmer Archipelago (Trinity Island and Doumer Island), along or near the west coast of the Peninsula (Prime Head, Hope Bay, Charlotte Bay, Cuverville Island, Petermann Island and Detaille Island) and at deep-field points in the Ellsworth Mountains (Union Glacier). b, PC loadings showing contributions to the first two PCs (PC1 and PC2). PC1 and PC2 explain 61% of the total variance. Colours represent likely sources: purple for elements typically associated with marine aerosols, brown for crustal sources, green for possible biogenic or non-sea-salt contributions and black for potential anthropogenic markers. c, PC scores. Points close to each other represent sampling sites with similar elemental profiles. The distribution suggests 4 potential clusters among the 16 sampling sites (identified by consecutive numbers). The first two PCs (PC1 and PC2) explained about 61% of the total variance and were influenced by elements associated with marine aerosols, crustal sources, biogenic and non-sea-salt contributions, and potential anthropogenic markers. Colours for the sites match those in a.

New paper on deep learning-based compressor station mapping published in Journal of Environmental Management

Our new paper, “Regional mapping of natural gas compressor stations in the United States and Canada using deep learning on satellite imagery“, is published in Journal of Environmental Management (IF: 8.4).

The paper can be downloaded at https://www.sciencedirect.com/science/article/pii/S0301479725027045.

Authors: Benjamin Liu, Jeremy Irvin, Mark Omara, Chenghao Wang, Gil Kornberg, Hao Sheng, Ritesh Gautam, Andrew Y. Ng, & Robert B. Jackson

Abstract: A comprehensive, open-access database of oil and gas infrastructure locations is necessary for accurately attributing emissions from satellites and managing pollution impacts on surrounding communities. However, open-access datasets are limited for many infrastructure types, including natural gas compressor stations, which account for approximately one-third of U.S. oil and gas sector methane emissions and are associated with harmful pollution. Here, we developed the first automated deep learning approach for detecting natural gas compressor stations in satellite imagery. We experimented with various neural network architectures trained on different image resolutions and footprints, and found that the best model achieved a precision of 0.81 at 0.95 recall. Incorporating whether a proposed facility is close to an oil and gas pipeline further improved model precision by 0.02. Deploying the best model to identify facilities across a critical 200,000 km2 oil and gas-producing region capturing the Marcellus Shale, we detected 1103 compressor stations that were not previously reported in a large bottom-up oil and gas infrastructure database. Incorporating these new locations revealed that population exposure to potential emitted pollutants may be underestimated by as much as 74 % when relying exclusively on reported data. Our work highlights the utility of machine learning to enhance infrastructure mapping for environmental management and pollution assessment.

DOI: https://doi.org/10.1016/j.jenvman.2025.126728

Fig. 4. Population exposure to potential air pollution emissions from compressor stations when using reported locations (left) compared to using both reported and newly detected locations using CSNet (right). Population exposure was estimated as the number of individuals residing within 1 km of compressor stations. The inset table shows the population exposure and underestimation (Underest.) for different distance thresholds when solely using the reported dataset.

Powered by WordPress & Theme by Anders Norén