Our new paper, “CHUWD-H v1.0: a comprehensive historical hourly weather database for U.S. urban energy system modeling“, is published in Scientific Data (IF: 5.8).
The paper can be downloaded at https://www.nature.com/articles/s41597-024-04238-4.
Authors: Chenghao Wang, Chengbin Deng, Henry Horsey, Janet L. Reyna, Di Liu, Sarah Feron, Raúl R. Cordero, Jiyun Song, & Robert B. Jackson
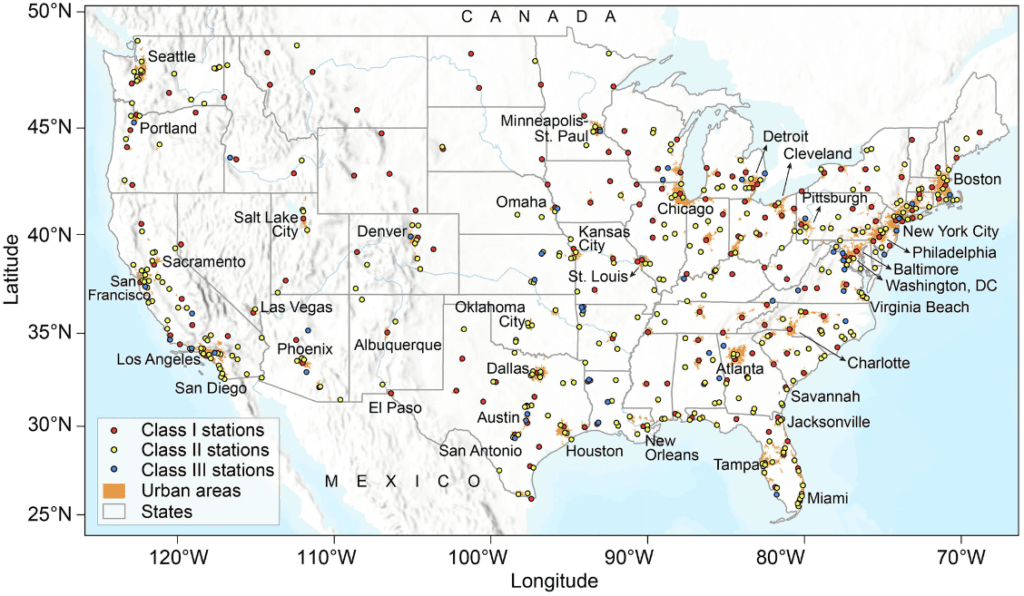
Abstract: Reliable and continuous meteorological data are crucial for modeling the responses of energy systems and their components to weather and climate conditions, particularly in densely populated urban areas. However, existing long-term datasets often suffer from spatial and temporal gaps and inconsistencies, posing great challenges for detailed urban energy system modeling and cross-city comparison under realistic weather conditions. Here we introduce the Historical Comprehensive Hourly Urban Weather Database (CHUWD-H) v1.0, a 23-year (1998–2020) gap-free and quality-controlled hourly weather dataset covering 550 weather station locations across all urban areas in the contiguous United States. CHUWD-H v1.0 synthesizes hourly weather observations from stations with outputs from a physics-based solar radiation model and a reanalysis dataset through a multi-step gap filling approach. A 10-fold Monte Carlo cross-validation suggests that the accuracy of this gap filling approach surpasses that of conventional gap filling methods. Designed primarily for urban energy system modeling, CHUWD-H v1.0 should also support historical urban meteorological and climate studies, including the validation and evaluation of urban climate modeling.
DOI: https://doi.org/10.1038/s41597-024-04238-4
Database DOI: https://doi.org/10.17605/OSF.IO/5DP8E
Interactive Data Platform: https://arcg.is/COWWe