Please visit our new lab website: https://chenghaow.github.io/

Author: Chenghao Wang Page 6 of 7

Sarah Henry successfully completed her REU project. Congratulations!

Sarah Henry has recently accomplished a successful National Weather Center REU project. Congratulations, Sarah!

Sarah delivering her work at the final presentation on Aug 21, 2023.

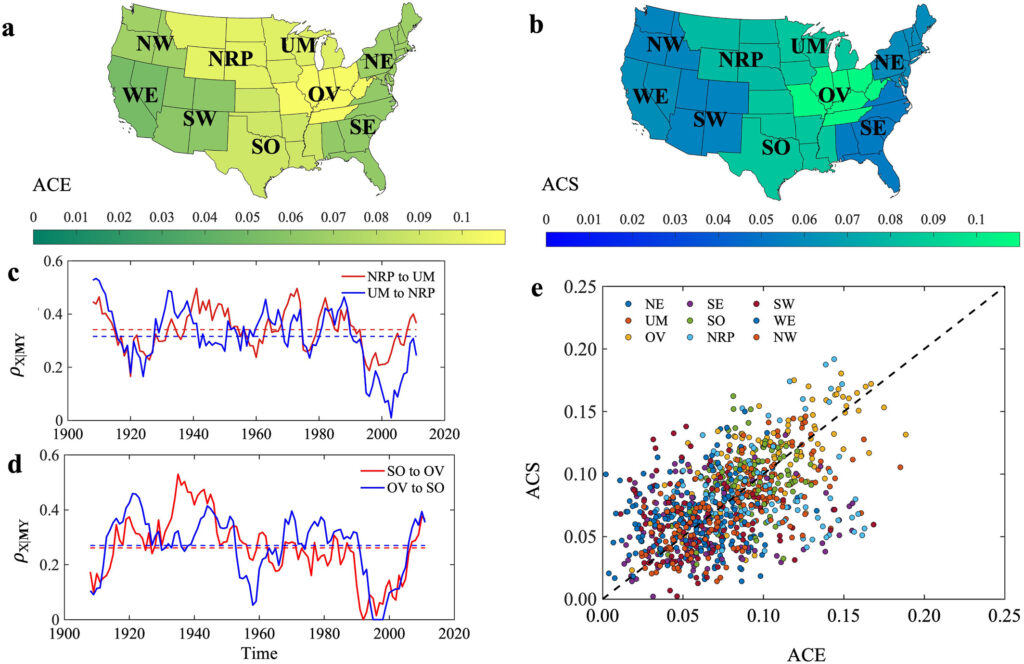
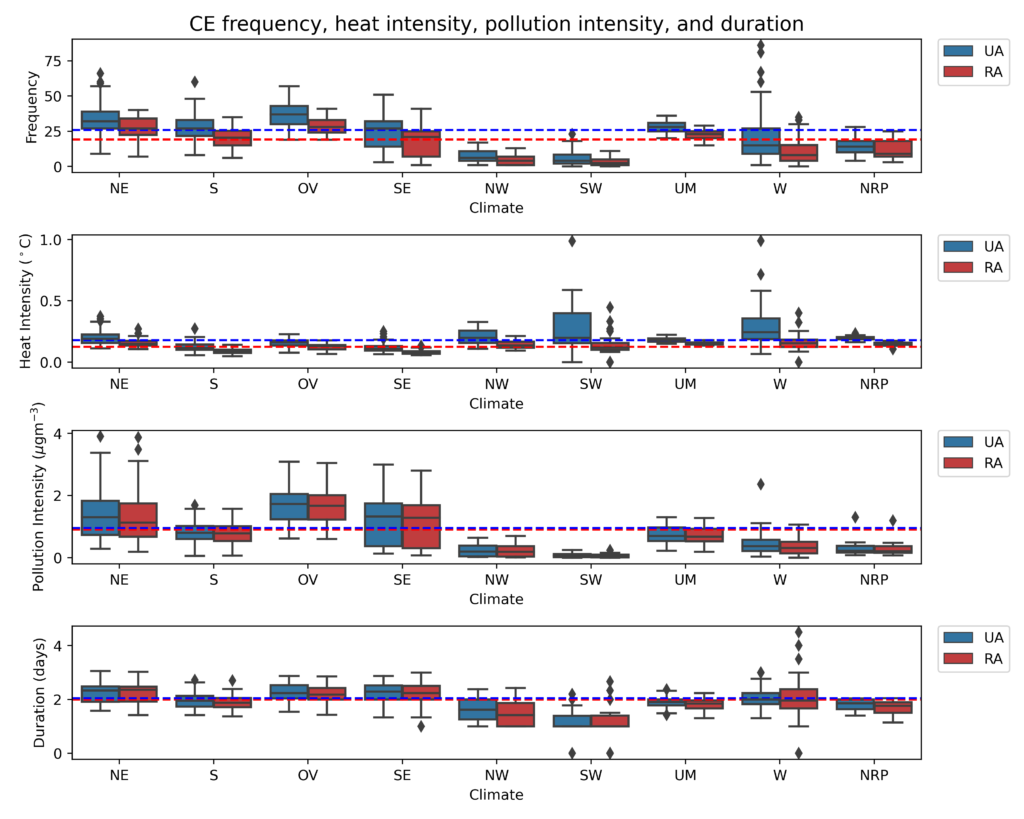
Throughout a 10-week journey, she investigated the spatial and temporal patterns of compound heat wave and particle pollution episodes in the urban environment across the contiguous U.S. (CONUS). Based on geospatial analyses of nighttime air temperature and daily PM2.5 concentration data, she found that, compared to rural surroundings, the majority of urban areas in the CONUS experienced more frequent, more intense, and longer-lasting heat waves, PM2.5 pollution days, as well as the compound episodes. Regionally, the Northeast and Ohio Valley exhibited the highest frequency of compound heat and pollution events, while the Northeast, Ohio Valley, and Southeast showed the longest durations of these events. Furthermore, the West and Southwest regions had the highest heat intensity during compound events, while the Northeast, Ohio Valley, and Southeast experienced the highest pollution intensity. Sarah’s research offers a pioneering perspective on compound heat and pollution episodes in U.S. cities, providing valuable insights for future investigations in this field.

Fig. 6. Regional comparison of compound events (CEs) frequency, heat intensity, pollution intensity, and duration for UAs and RAs based on NOAA’s 9 climate regions: Northeast (NE), South (S), Ohio Valley (OV), Southeast (SE), Northwest (NW), Southwest (SW), Upper Midwest (UM), West (W), and Northern Rockies and Plains (NRP). Red dashed line indicates Rural Area (RA) average, and blue dashed line indicates Urban Area (UA) average. The center line of each box is the median, the box extends from lower to upper quartiles, vertical lines denote 1.5 times the interquartile range, and diamonds are outliers.

Her final paper titled “Compound Heat Wave and PM2.5 Pollution Episodes in U.S. Cities” has been posted on arXiv (https://doi.org/10.48550/arXiv.2307.15296) and is also available on REU’s website.

The REU program is funded by the National Science Foundation under Grant No. AGS-2050267. More information about REU and how to apply can be found here.

New paper on compound urban heat-ozone pollution published in Scientific Reports

Our new paper, “Compound climate-pollution extremes in Santiago de Chile“, is published in Scientific Reports (IF: 4.996).

The paper and its supplement can be downloaded at https://www.nature.com/articles/s41598-023-33890-w.

Authors: Sarah Feron, Raúl R. Cordero, Alessandro Damiani, Pedro Oyola, Tabish Ansari, Juan C. Pedemonte, Chenghao Wang, Zutao Ouyang, and Valentina Gallo

Abstract: Cities in the global south face dire climate impacts. It is in socioeconomically marginalized urban communities of the global south that the effects of climate change are felt most deeply. Santiago de Chile, a major mid-latitude Andean city of 7.7 million inhabitants, is already undergoing the so-called “climate penalty” as rising temperatures worsen the effects of endemic ground-level ozone pollution. As many cities in the global south, Santiago is highly segregated along socioeconomic lines, which offers an opportunity for studying the effects of concurrent heatwaves and ozone episodes on distinct zones of affluence and deprivation. Here, we combine existing datasets of social indicators and climate-sensitive health risks with weather and air quality observations to study the response to compound heat-ozone extremes of different socioeconomic strata. Attributable to spatial variations in the ground-level ozone burden (heavier for wealthy communities), we found that the mortality response to extreme heat (and the associated further ozone pollution) is stronger in affluent dwellers, regardless of comorbidities and lack of access to health care affecting disadvantaged population. These unexpected findings underline the need of a site-specific hazard assessment and a community-based risk management.

DOI: https://doi.org/10.1038/s41598-023-33890-w

Fig. 1. While socioeconomic inequalities generally drive disparities in the mortality rate, the gap between rich and poor considerably narrows during summer. (a) Annual mortality rate (number of annual deaths per 100,000 population) in individuals aged 65 and over across Santiago, averaged over the period 2010–2019. (b) Daily mortality rate in inhabitants (aged ≥ 65 years) of Santiago. (c) Daily mortality rate in inhabitants (aged ≥ 65 years) of Santiago, averaged over two periods: 1993–2002 (blue line) and 2010–2019 (red line). (d) Annual income per capita (2017 US$) across Santiago. (e) Progress of winter mortality rate in inhabitants (aged ≥ 65 years) of affluent (blue line) and deprived (red line) municipalities over the period 1992–2019. (f) Progress of summer mortality rate in inhabitants (aged ≥ 65 years) of affluent (blue line) and deprived (red line) municipalities over the period 1992–2019.

New paper on causal networks of precipitation published in Geophysical Research Letters

Our new paper, “Finding causal gateways of precipitation over the contiguous United States“, is published in Geophysical Research Letters (IF: 5.576). This paper is from the collaboration with the Urban Environment Research Group at Arizona State University (ASU).

The paper and its supplement can be downloaded at https://agupubs.onlinelibrary.wiley.com/doi/10.1029/2022GL101942.

Authors: Xueli Yang, Zhi-Hua Wang, Chenghao Wang, and Ying-Cheng Lai

Abstract: Identifying regions that mediate regional propagation of atmospheric perturbations is important to assessing the susceptibility and resilience of complex hydroclimate systems. Detecting the regional gateways through causal inference, can help unravel the interplay of physical processes and inform projections of future changes. In this study, we characterize the causal interactions among nine climate regions in the contiguous United States using long-term (1901–2018) precipitation data. The constructed causal networks reveal the cross-regional propagation of precipitation perturbations. Results show that the Ohio Valley region acts as an atmospheric gateway for precipitation and moisture transport in the U.S., which is largely regulated by the regional convective uplift. The findings have implications for improving predicative capacity of hydroclimate modeling of regional precipitation.

Plain Language Summary: Successful detection of causality in complex systems is important to unraveling the underlying mechanisms of system dynamics. The dynamic interactions in Earth’s climate system are often nonlinear, weakly or moderately coupled, and essentially non-separable, which renders conventional approaches of causal inference, such as statistical correlation or Granger causality, infeasible or ineffective. Here we applied the convergent cross mapping method to detect causal influence among different climate regions in the contiguous U.S. in response to precipitation perturbations. The results of our study show that the Ohio Valley region, as an atmospheric convergence zone, acts as a regional gateway and mediator for the long-term precipitation perturbations in the U.S. The temporal evolution of causal effect and susceptibility exhibits superposition of climate variability at various time scales, highlighting the impact of prominent climate variabilities such as El Niño–Southern Oscillation on the dynamics of causality.

DOI: https://doi.org/10.1029/2022GL101942

Fig. 3. Measuring causal effect in the dynamical network of precipitation in the CONUS. (a) and (b) Long-term averaged causal effect (ACE) and averaged causal susceptibility (ACS) for each climate region. (c) Evolution of the strength of the CCM causality over time (with a 15-year sliding window) between two adjacent regions: NRP (Northern Rockies and Plains) and UM (Upper Midwest). (d) Time evolution of the CCM causality strength between the South and Ohio Valley. The horizontal dashed lines in red or blue in (c) and (d) represent the mean values of CCM causality strength. (e) ACE versus ACS over all 15-year sliding windows for each climate region.

New paper on moisture sources of precipitation in the Tibetan Plateau published in Hydrology and Earth System Sciences

Our new paper, “Spatial distribution of oceanic moisture contributions to precipitation over the Tibetan Plateau“, is published in Hydrology and Earth System Sciences (IF: 6.617).

The paper and its supplement can be downloaded at https://hess.copernicus.org/articles/26/6413/2022/.

Authors: Ying Li, Chenghao Wang, Ru Huang, Denghua Yan, Hui Peng, and Shangbin Xiao

Abstract: Evaporation from global oceans is an important moisture source for glaciers and headwaters of major Asian rivers in the Tibetan Plateau (TP). Although the accelerated global hydrological cycle, the altered sea–land thermal contrast and the amplified warming rate over the TP during the past several decades are known to have profound effects on the regional water balance, the spatial distribution of oceanic moisture contributions to the vast TP remains unclear. This hinders the accurate quantification of regional water budgets and the reasonable interpretation of water isotope records from observations and paleo archives. Based on historical data and moisture tracking, this study systematically quantifies the absolute and relative contributions of oceanic moisture to long-term precipitation in the TP. Results show that the seasonal absolute and relative oceanic contributions are generally out of phase, revealing the previously underestimated oceanic moisture contributions brought by the westerlies in winter and the overestimated moisture contributions from the Indian Ocean in summer. Quantitatively, the relative contribution of moisture from the Indian Ocean is only ∼30 % in the south TP and further decreases to below 10 % in the northernmost TP. The absolute oceanic contribution exhibits a spatial pattern consistent with the dipole pattern of long-term precipitation trends across the Brahmaputra Canyon region and the central-northern TP. In comparison, relative oceanic contributions show strong seasonal patterns associated with the seasonality of precipitation isotopes across the TP.

DOI: https://doi.org/10.5194/hess-26-6413-2022

Fig. 8. Locations of the precipitation isotope monitoring stations and the relationship between the monthly relative IO moisture contributions (blue lines) and the precipitation isotope observations (dotted lines). Sites 1–13, 14–17 and 18–19 represent stations located within the monsoon domain, transition domain and westerlies domain, respectively. Blue lines show the mean IO moisture contributions based on three simulations, while the shadings show the range (detailed seasonal variations of three simulations are shown in Fig. S14). Note that for consistency, oceanic contributions below 10% and above 50% are not shown for sites 12 and 18.

Upcoming presentations at AGU Fall Meeting 2022

Come to our presentations at AGU Fall Meeting in Chicago!

GC15D-04: Heterogeneous Response of City-level Building Energy Use to Future Climate Change, Socioeconomic Development, and Power Sector Decarbonization

Time: 3:20 pm – 3:30 pm, Monday, Dec 12, 2022

Room: McCormick Place – S504abc (South, Level 5)

Presenter: Chenghao Wang

Session: GC15D: Multi-sector Dynamics: Environmental Change, Resilience, and Society in Urban Areas Under a Changing Climate II Oral

Abstract Link: https://agu.confex.com/agu/fm22/meetingapp.cgi/Paper/1083474

NG25B-0390 – Finding Causal Gateways of Heatwave Propagation among U.S. Cities

Time: 2:45 pm – 6:15 pm, Tuesday, Dec 13, 2022

Room: McCormick Place – Poster Hall‚ Hall A, Board 0390

Presenter: Xueli Yang

Session: NG25B: Extreme Variability and Complexity: Bridging Mathematics, Physics, and Information Technologies from Urban Systems to Climate, Geophysics, and Pandemics III Poster

Abstract Link: https://agu.confex.com/agu/fm22/meetingapp.cgi/Paper/1060203

GC36D-08 – A Single-Layer Urban Canopy Model with Transmissive Radiation Exchange between Trees and Street Canyons

Time: 6:04 pm – 6:15 pm, Wednesday, Dec 14, 2022

Room: McCormick Place – S502ab (South, Level 4)

Presenter: Chenghao Wang

Session: GC36D: Urban Areas and Global Change III Oral

Abstract Link: https://agu.confex.com/agu/fm22/meetingapp.cgi/Paper/1084322

New paper on vegetation response to climate change and human activities published in Ecological Indicators

Our new paper, “Vegetation dynamics influenced by climate change and human activities in the Hanjiang River Basin, central China“, is published in Ecological Indicators (IF: 6.263).

The Share Link to download a copy of our paper is https://authors.elsevier.com/sd/article/S1470-160X(22)01059-7 (valid until Dec 11, 2022).

Authors: Shaokang Yang, Ji Liu, Chenghao Wang, Te Zhang, Xiaohua Dong, and Yanli Liu

Abstract: Assessing the dynamics of vegetation and its response to environmental changes is essential to understanding ecosystem changes and the sustainable use of natural resources. In this study, we investigated the impacts of climate change and human activities on vegetation growth in the Hanjiang River Basin. We classified the basin into the portion mainly affected by climate change (VClimate) and the portion affected by both climate change and anthropogenic activities (VClimate+Human). Using an improved residual trend method that considers both lag effect and nonlinear response, we analyzed the relative contributions of climate change and human activities to observed NDVI changes. Results suggest that the basin experienced a statistically significant increase in growing-season NDVI during 2001–2016 (0.047 decade-1). Precipitation was the dominant climatic factor for NDVI change in VClimate+Human, whereas precipitation and temperature were nearly equally important for NDVI change in VClimate. On average, both climate change and human activities promoted vegetation growth during the study period, and their average contributions were 41.4 % and 15.5 %, respectively. In particular, climate change and human activities in general enhanced vegetation growth in non-urban areas, while human activities mainly reduced vegetation growth in urban areas. The findings of this study can benefit regional ecological restoration and environmental management projects.

DOI: https://doi.org/10.1016/j.ecolind.2022.109586

Fig. 8. Contributions of climate change and human activities to growing-season NDVI dynamics in the HJRB in 2001–2016: (a) contribution of precipitation and temperature change (C1 in both VClimate and VClimate+Human), (b) contribution of changes in climatic factors other than precipitation and temperature (C2 in VClimate), (c) contribution of changes in all climatic factors (C1 and C2 in VClimate and C1 in VClimate+Human), and (d) contribution of human activities (C2 in VClimate+Human). Solid circles in black (with names) in (d) are cities. The inset in each subplot shows the distribution of contributions.

New course for spring 2023 – Urban Climatology!

Dr. Chenghao Wang will teach a new course, GEOG/METR 4970-004: Urban Climatology, in spring 2023.

New paper on urban thermal stress modeling published in Renewable and Sustainable Energy Reviews

Our new paper, “Realistic representation of city street-level human thermal stress via a new urban climate-human coupling system“, is published in Renewable and Sustainable Energy Reviews (IF: 16.799). This paper is from the collaboration with the Healthy Cities Laboratory at The University of Hong Kong.

The Share Link to download a copy of our paper is https://authors.elsevier.com/a/1flIY4s9Hw6370 (valid until Nov 03, 2022).

Authors: Xinjie Huang, Jiyun Song, Chenghao Wang, and Pak Wai Chan

Abstract: Urban overheating aggravated by climate change and rapid urbanization poses a severe threat to thermal health of urban residents. To more realistically represent street-level heat stress, we propose a new urban climate-human coupling system by integrating an advanced urban canopy model (UCM) with a new human-environment adaptive thermal stress (HEATS) module. The coupled UCM-HEATS system features a state-of-the-art solution to complicated human-street radiative exchanges and incorporates dynamic human thermoregulatory responses to microclimatic changes. The UCM-HEATS system was evaluated in a typical hot and humid city, Hong Kong, and then applied to investigate street-level thermal stress in various urban settings and under different personal conditions. By explicitly resolving shading effects of buildings and trees on human radiation budgets, our study emphasizes the marked effectiveness of active shade management using green and gray infrastructure on daytime heat mitigation, proposing a “right shade, right place, right time” paradigm for regulating important street canyon geometries (building height, road width, and tree crown width) and orientations. Additionally, human evaporative heat dissipation can be hindered by urban moisture islands and wind impediments; thus, a detailed urban ventilation strategy is suggested considering different temperature-humidity combinations. For personal heat protection, we identified an evident cooling effect of high-albedo clothing and a thermal-comfort-optimal walking speed. Special attention is paid to heat-vulnerable groups, especially older people who suffer from notably higher heat risks during pandemics with facemask-induced heat burden. Bridging urban climate and human ergonomics, this study aims to advance human-centric urban design toward future smart, resilient, and inclusive cities.

DOI: https://doi.org/10.1016/j.rser.2022.112919

Fig. 2. Schematic of the Urban Canopy Model-Human-Environment Adaptive Thermal Stress (UCM-HEATS) model.

We are seeking Ph.D. students to join our lab!

The Sustainable URban Futures (SURF) Lab in the School of Meteorology and the Department of Geography and Environmental Sustainability at the University of Oklahoma in Norman, Oklahoma, USA is seeking self-motivated doctoral students who are willing to pursue research in the areas of urban climate and urban meteorology. The successful candidate will enroll in the Ph.D. program in either Meteorology or Geography and Environmental Sustainability.

For prospective Ph.D. students, a master’s degree in meteorology, atmospheric science, geography, engineering, Earth science, or environmental science is preferred but not required. Candidates with experience in using programming languages, geographic information system, and/or remote sensing products are especially encouraged to apply. Successful candidates will work with Dr. Chenghao Wang and his collaborators at the University of Oklahoma and other research institutes. With the strong modeling and/or data analysis skills developed during the training, successful candidates will have the opportunity to study a wide range of urban issues and challenges as well as potential mitigation and adaptation measures on the path toward sustainable and resilient urban environments, and eventually to push the boundaries of our knowledge about past, present, and future cities.

If you are interested, please contact Dr. Chenghao Wang (chenghao.wang@ou.edu) by Oct 15, 2022 and attach (1) a copy of your CV, (2) a brief statement that highlights your interest (and skills and previous research experience, if applicable) relevant to the Sustainable URban Futures (SURF) Lab, and (3) a copy of unofficial academic transcripts. Review of applications will begin immediately and continue until the position is filled.

Founded in 1890, the University of Oklahoma is a public research university located in Norman, Oklahoma just 20 mins. south of Oklahoma City, one of the top 50 metropolitan areas in the United States. The university is classified among “R1: Doctoral Universities – Very high research activity”. More information regarding the University of Oklahoma, the School of Meteorology, the Department of Geography and Environmental Sustainability, and available degree programs can be found https://sites.create.ou.edu/chenghaowang/about/.

For further information, please contact Dr. Chenghao Wang.

A PDF version of this post in English can be downloaded here

中文版招生简介可从此处下载

We are organizing a Special Issue “Using Remote Sensing and GIS Technique/Methods to Address Current Urbanization Issues” in Remote Sensing

We are running a Special Issue entitled “Using Remote Sensing and GIS Methods to Study Current Urbanization Issues” with the journal Remote Sensing (IF: 5.349, ISSN 2072-4292). This special issue belongs to the section “Urban Remote Sensing“. The guest editors for this issue are Dr. Zutao Ouyang from Stanford University, Dr. Chenghao Wang from the University of Oklahoma, and Dr. Peilei Fan from Michigan State University. The submission deadline is April 30, 2023.

Further details on this Special Issue and how to submit can be found here: https://www.mdpi.com/journal/remotesensing/special_issues/Y602B3CNT6.

The increase in the number of people living in urban areas, the proliferation of megacities, and the pervasive expansion of per-urban areas are some of the most challenging transformations in the 21st century. The complexity of urbanization imposes intertwined social, economic, and environmental impacts. While urbanization can achieve social and economic benefits, such as improved education, job opportunities, and healthcare, it also brings numerous negative ecological and social consequences, such as increasing the cost of living and social and economic inequality, deforestation, loss of natural habitat and biodiversity, soil, air, and water pollution, increased emission of greenhouse gases, heat island effect, and increased risk of disease. Therefore, it is imperative to create a sustainable urban environment that reconciles the conflicts between human and natural systems and reduces the negative impacts of the urbanization process. Remote sensing techniques could provide a “unique view” of the urban landscape. When combined with GIS-based spatial analysis, it can serve as a powerful tool to study processes and patterns of urbanization, drivers and impacts of urbanization, and the coupled human and natural systems embedded in urban ecosystems.

The main objective of this Special Issue shall be to provide a scientific forum for advancing the successful implementation of remote sensing (RS) technologies and geographic information system (GIS)-based methods towards urbanization issues and the peri-urban environment and to foster informed debates among scientists and stakeholders on the environmental issues prevalent therein, relating these to city growth dynamics.

This Special Issue will provide readers in the fields of GIS, remote sensing, Earth science, environmental science, and computer science with theoretical and practical advances in urbanization-related research. Topics of research articles, or reviews, submitted to this Special Issue include, but are not limited to:

  • Integration of remote sensing data for urban environmental analysis.
  • Novel remote sensing applications (new sensors, new methodology, etc.) in urban ecology and sustainability.
  • Tracking urban growth and land use change with remote sensing technologies and GIS tools.
  • Remote sensing and GIS analysis informing/supporting urban and peri-urban governance and planning.
  • Landscape ecological analysis.
  • Urban growth and fringe development.
  • Water, river, and lake monitoring in and surrounding urban areas.
  • Relations between urban growth and climate change.
  • Social and environmental justice issues relevant to urban residents.
  • Impacts and mitigation of urban heat.

Page 6 of 7

Powered by WordPress & Theme by Anders Norén