Our new paper, “Assessment of convection-permitting hydroclimate modeling in urban areas across the contiguous United States“, is published in Urban Climate (IF: 6.0). This work was led by undergraduate student Liam Thompson. Congratulations, Liam!
The paper can be downloaded at https://www.sciencedirect.com/science/article/pii/S2212095525000914.
Authors: Liam Thompson, Chenghao Wang, Cenlin He, Tzu-Shun Lin, Changhai Liu, and Jimy Dudhia
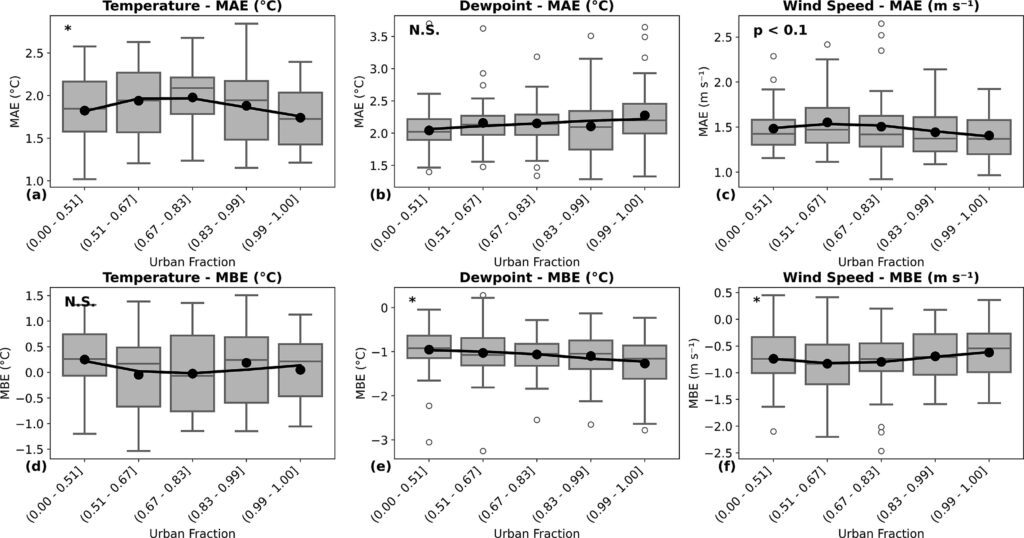
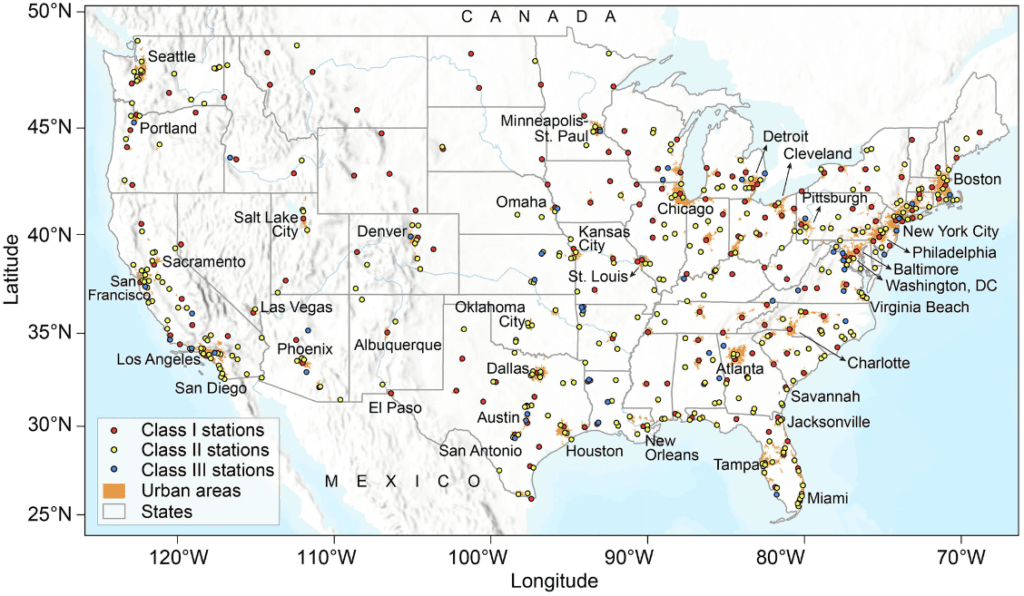
Abstract: Accurate representation of urban areas in weather and climate models is crucial for simulating interactions between urban surfaces and the atmospheric boundary layer, especially in high-resolution regional models that resolve deep convection. However, many continental-scale simulations use simplified urban parameterizations, raising questions about their ability to reproduce urban hydroclimate. This study evaluates CONUS404—a recent USGS-NCAR 4-km convection-permitting hydroclimate modeling dataset—in urban areas across the contiguous United States (CONUS). We assessed hourly near-surface air temperature, dewpoint, and wind speed simulations at 208 urban and 342 non-urban station locations from 2011 to 2020 using observations. Results show that CONUS404 performs better for air temperature in urban areas, with a slight mean warm bias (0.08 °C) at urban stations and a mean cold bias (−0.52 °C) at non-urban stations. Dewpoint simulations exhibit stronger dry biases at urban stations, suggesting underrepresented evapotranspiration from urban vegetation. Wind speed is generally underestimated, with average biases of −0.74 m s−1 at urban and −0.35 m s−1 at non-urban stations. Seasonal analyses reveal larger model errors for wintertime temperature and dewpoint that strongly depend on urban fraction. These findings highlight the limitations of the bulk urban parameterization in CONUS404, underscoring the need for enhanced urban representations to improve continental-scale hydroclimate simulations.
DOI: https://doi.org/10.1016/j.uclim.2025.102375